Hello,
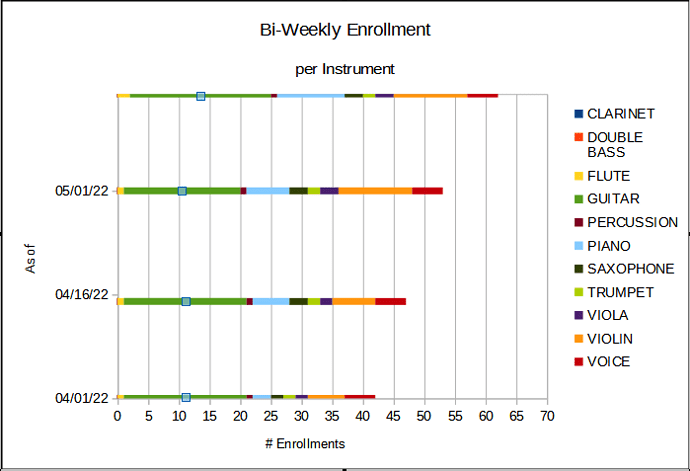
I am trying to make the bars on my bar graph wider (see attached image), however I cannot figure out why adjusting the spacing does not work. The spacing of the bars is how they automatically were generated, and the spacing was automatically set at 0%, and this is true for every data series (in this case, the data for every instrument). I tried adjusting the spacing higher, or putting it at a negative amount, and the only thing I could do was make the bars even narrower and further apart. I tried increasing the overlap and nothing happened. None of the other solutions I have found online address this issue, because they all say to adjust the spacing.
Since I cannot upload a second photo, in the “format data series” options menu, my spacing is set at 0%, and overlap is set at 0%. Does someone know what the problem might be?

