How to change a bar graph with x Axis formated as “Date”. On the speadsheet data range this dates are not Included (Weekeds and Public Holidays), But when I graph the sheet, the weekend show on the x-axis .
Sample.ods (51.3 KB)
Please uploasd an ODF (.ods) type sample file here.
Sample Uploaded
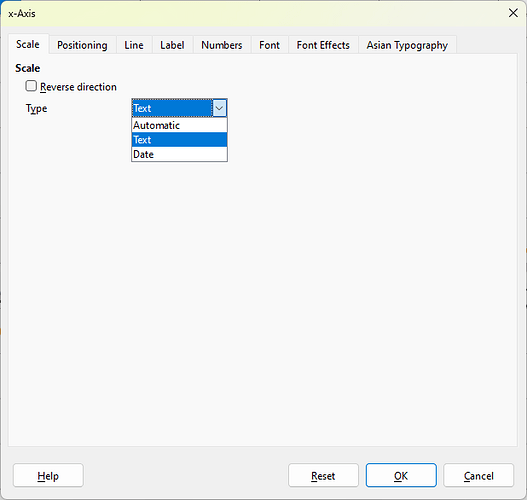
On the axis’ properties dialog’s Scale tab, choose Text type, not Automatic nor Date:
When you choose Date (or Automatic, which in your case defaults to Date), the axis becomes a range of numbers, and thus it includes all numbers between the start and the end - including anything that you omitted in the source data.
1 Like
Thanks Mike , Perfect, Best regards

