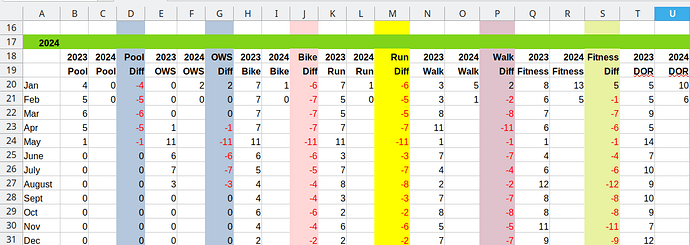
I keep failing at creating a bar chart that displays data for 7 column categories: pool, ows, bike, run, fitness, walk, dor which are each displayed for two years: 2023 and 2024. I do not care about the diff columns in the bar chart. I attached a screenshot of my calc sheet. How do I accomplish this? On y-axis, the count for each event and on x-axis each category broken down in adjacent years 2023/2024. Therefore, there would be 14 bars, two each for each category.
pivot_102055.ods (38.4 KB)
The data sheet (yellow tab) has a normalized list with years, months, categories and points, each in one column.
Sheet2 has the validation list of the categories column on Sheet1.
From the normalized source data, I created a pivot table on the red tab with categories as column field, years as row field and values as summed data field, ignoring the months.
From the pivot table, I created a bar chart.
The green sheet tab has another pivot table showing the differences of values compared to the previous months.
The entire document does not contain a single formula.
I did not waste any time with formatting.
- A normalized list is easy to maintain. Just insert some new row of cells anywhere in the list before entering a new record.
- A normalized list is computer friendly. Most of Calc’s data analysis features presume a normalized list.
- A normalized list works in any order of rows. Notice, that my list is sorted randomly. You can sort it in any order you want without losing functionality.
- A normalized list can be filtered easily. Use the auto-filter buttons in the header row to show the records of any selected category or categories for any year, month or time span.
- You can derive many pilot tables from the same normalized list, each one aggregating another aspect of the same source data.
since you’re trying to do something just pretty standard
https://books.libreoffice.org/en/CG71/CG7103-ChartsAndGraphs.html#toc10
… I guess you should describe what you actually do (apparently wrong) if you need more help 

