Calc/chart: Can Anyone Explain What's Happening Here?!?

CAVEAT: I know nothing about Calc, I never use it, I don’t know formulas or abbreviations for formulas or any other Calc related information.

OK I’ll start with the system details:
OS: Win 10
LibreOffice Version 6.2.5.2 (x64)
(If more info is needed, please ask!)

I need to know what the heck is going on in this picture. It hasn’t been modified in anyway. It is a screen shot of what I’m working on. And most importantly; IT ISN’T A JOKE.

I am trying desperately to create a data chart to track my blood pressure for a serious medical condition. So, my first go-to was LibreOffice writer. Well, that didn’t do what I needed, so my husband recommended Calc. He then walked me through entering the data and the formulas needed. (He uses it occasionally at work.) Then we tried to create a chart. We first tried using a Line chart and noticed that there were no date/time references at all. (I went online to find that a scatter chart might work.) I created a scatter chart and found that, 1 - It didn’t include the time and 2 - It had created data out of wholecloth!!

image description

The only data colums included in the chart are the following: Column A, Column D, and Column E. (as I don’t know how to add the conditions to the chart, they are not listed. Also, the BP has been modified to a numeric representation so that it IS chart-able.)

ANY assistance would be useful and useful assistance would be wonderful!

Thanks!

DHBrown

Please upload a file, not a screenshot.

A couple of suggestions – Plotting a chart with dates and times on one axis is tricky. For plotting long time- series data, like a month’s worth of measurements, I usually calculate the time of day as a fraction of the day and then add that to the day number, so for example 12 noon on the 17th of the month becomes 17.500. That is easily plotted on the x-axis of an x-y scatter chart and is unambiguous and doesn’t take up a lot of room as a label on the axis. But to “read” the chart you have to be able to interpolate. Secondly, you might consider plotting your blood pressure as two separate numbers (systolic and diastolic) instead of trying to combine them into one chartable value. So you get a line of values for the systolic readings and a line of values for the diastolic readings, all on the same chart. Also, be aware that x-y scatter charts are very editable with many options and you will have to adjust the default values that LO Calc chooses to begin with.

Plainly put, I cant do the time of day in that manner. I have to know the time down to the minutes. The blood pressure is readable to me as is, so I won’t need to change that. Hubby helps me when it comes to adjusting the default values as he understands a little bit about the program.

“to know the time down to the minutes”

Calculating the time of day as thousandths (0.001) of a day gives you a resolution of 1.4 minutes.

BD: The linked graph appears correct. The axes are ranging the data I see, and the data points are connected with a line. I will speculate that the timeline isn’t intended to be that disparate, deforming the scales and appearance. If intentional, perhaps a non-linear scale would make things prettier.

LG: A comment then, not a big deal. I understand my comment is brief, but I feel it is concise and exactly " explains what’s happening here." I suspect leaning back and pausing might be more productive than complex statements and samples.

I’m not quite sure where or how you see the graph as correct…? The graph has dates on it that aren’t even in the data. Not to mention, the times aren’t correlating with the pulse and BP. I’m confused about your comment.

I give up.

@DHBrown,

Could you take a piece of paper and sketch how do you expect the graph to look like? Maybe with colored pencils. Then edit your question and use the paperclip to share a photo with us.

Hard to tell what happens from a picture. Looks like a serious mixup of data ranges.

See if you can use this instead. Should show a sensible representation of pulse/bp, but I don’t know if it is useful in any way. Enter data only in the framed cells, down to row 51 if you need.

The date/time field may behave erratically upon input. Mixing Norwegian and US formatting/locale did that to me. I think I got it sorted, but upon moving to new locale it may misbehave again. If it does, comment below and I’ll try to fix.

Also, if you can confirm that it is what you need, I’ll try to explain the steps to recreate.

What you have her KINDA works. I don’t understand what the long green lines are. The dates are great but the green lines have me a bit confused… Is it like so: the top (red arrow) the systolic and the bottom of the green line the diastolic? How do I go about getting the actual numbers of the reading?

Is it like so: the top (red arrow) the systolic and the bottom of the green line the diastolic?

Correct. I was unable to divine from the picture how to produce your “chartable bp indicator”, so I used actual values. Don’t know whether that is of any use to you.

How do I go about getting the actual numbers of the reading?

They are in the table. Do you also need them in the graphical chart?

You can add data labels to each data pointer in a chart, but the green lines are “error bars” without a separate data point at the bottom, so inserting the diastolic value needs a few extra steps.

I used error bars as an easy way to connect the two bp values. It gets easier if you don’t have any use of the connection.

Why give up? Because you can’t get what you want? Maybe there are things about charts and graphs that you don’t understand yet. Charts are only graphical representations of the data, showing trends, maxima and minima, and it often happens that you can’t put all of the information into one chart or graph. As pointed out by @keme, that is what the table is for. If you see an interesting area on a graph, you look up that area in the table to see what the actual data was.

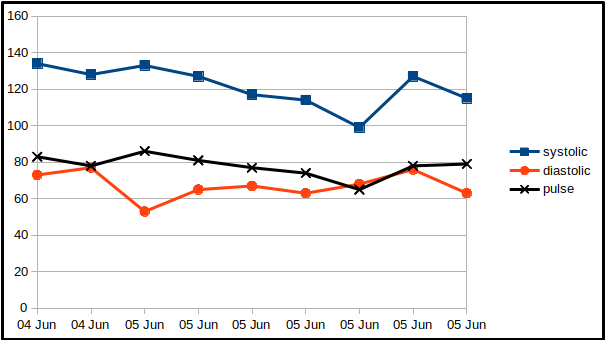
Maybe you are looking for something like this :

image description

This is a type Line Chart with the dates on the x-axis entered as text, rather than numbers. I did not include the times of your observations because that would make the x-axis very crowded, but there are some tricks to minimize that.

YES! That is what I’m looking for! But the data has to be available on the chart as I can’t carry around a 120 page document with me, but I can carry around 6 pages of charts!

With all due respect, I think you exaggerate. Charts usually have a lot of empty space while tables can be quite compact. Certainly not a 20:1 ratio.

In any case, I would suggest that there could be one table for each chart and, if the time is divided up in a suitable way, you could probably fit a table and its corresponding chart on the same page. Maybe one page per day? Would that fit your situation?

@DHBrown : To go back to your original question, it is impossible to fully explain what is going on because you posted only a screen shot of your results, instead of the actual Calc file, as requested by @Grantler. As a result we can only guess at what might cause the results you display. And when facts matter (as they almost always do), wise people try to avoid guessing.

And as @LeroyG has suggested, it would help if you could show us an example of what you want your chart to look like.

So there are two things that you can do to help us, to help you.