CAVEAT: I know nothing about Calc, I never use it, I don’t know formulas or abbreviations for formulas or any other Calc related information.
OK I’ll start with the system details:
OS: Win 10
LibreOffice Version 6.2.5.2 (x64)
(If more info is needed, please ask!)
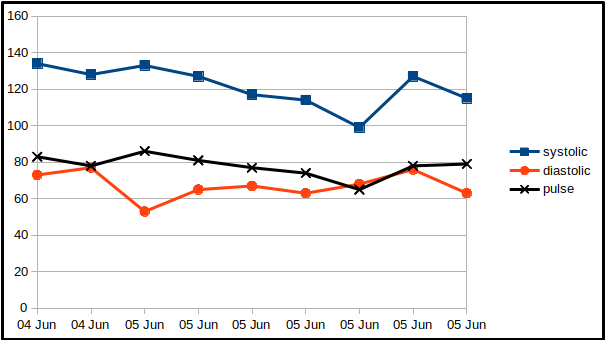
I need to know what the heck is going on in this picture. It hasn’t been modified in anyway. It is a screen shot of what I’m working on. And most importantly; IT ISN’T A JOKE.
I am trying desperately to create a data chart to track my blood pressure for a serious medical condition. So, my first go-to was LibreOffice writer. Well, that didn’t do what I needed, so my husband recommended Calc. He then walked me through entering the data and the formulas needed. (He uses it occasionally at work.) Then we tried to create a chart. We first tried using a Line chart and noticed that there were no date/time references at all. (I went online to find that a scatter chart might work.) I created a scatter chart and found that, 1 - It didn’t include the time and 2 - It had created data out of wholecloth!!
The only data colums included in the chart are the following: Column A, Column D, and Column E. (as I don’t know how to add the conditions to the chart, they are not listed. Also, the BP has been modified to a numeric representation so that it IS chart-able.)
ANY assistance would be useful and useful assistance would be wonderful!
Thanks!
DHBrown

