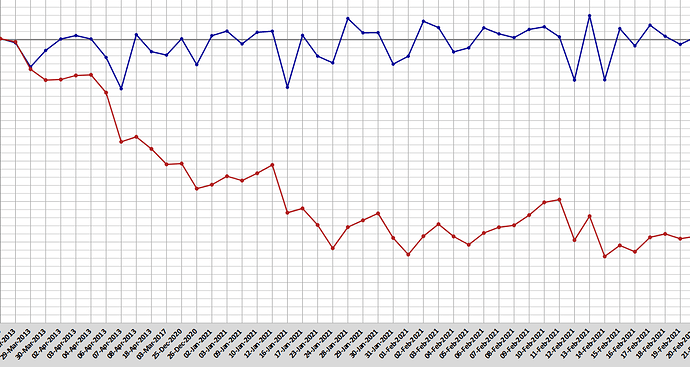
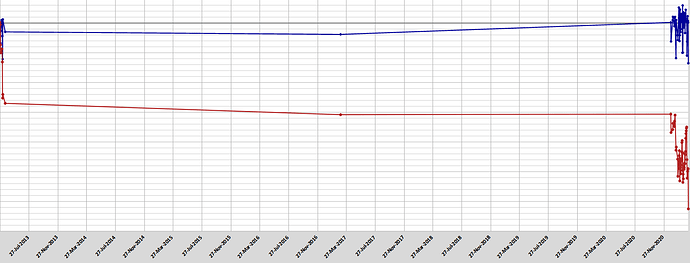
Hello, I have a rather odd issue with LibreOffice Calc. Whenever I create a line chart from 3 columns of data, two of which contain values for two function lines and one which containes date for the x-axis labels, everything looks perfect. Then when I close the file and open it again, the x-axis decides of its own volition to change itself from ‘text’ to ‘date’ and thus the previously monotonous intervals are distorted (e.g. if there are three dates, the first of which is from 2013 and the last two are from 2021, there is a huge empty space between them in the chart). This distorts the picture dramatically and whenever I try to change it back, it only works until the next time the file is opened. Illustration:
Why does this happen and is there a way to undo it? Microsoft Excel has never had such inclinations and it is quite annoying.
Thanks in advance for any suggestions on how to correct that.
PS: Turns out this happens when I save the original file as .xlsx - I saved it as .ods and this appears to have stopped happening - is that conclusively gone now?
(Edit: activated screenshots -AK)


