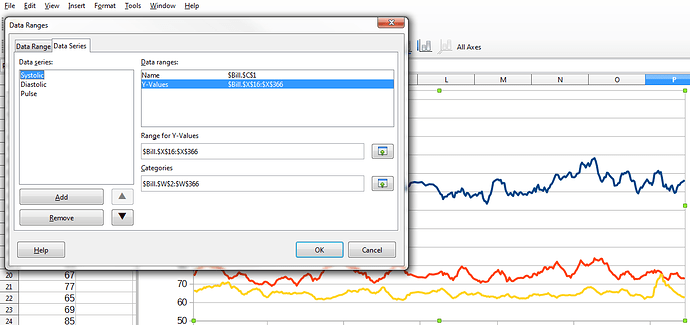
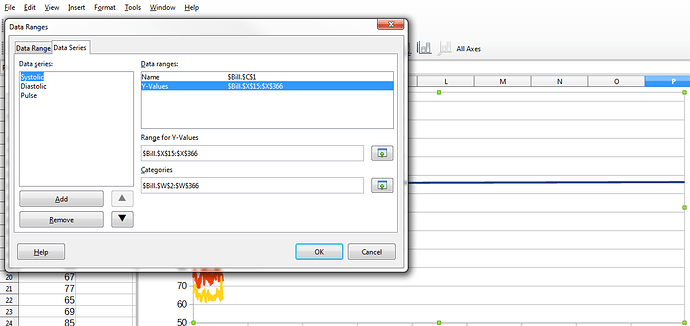
Using Version: 6.0.1.1.
I’ve opened and edited a spreadsheet that I have maintained for many years. Suddenly, the chart won’t retain the settings. Primarily, the “data ranges” opens up with BOTH “first row as label” and “first column as label” selected. This is incorrect, as the data are in columns. “First column as label” should be checked, but “first row as label” should NOT be checked. I can’t deselect that option.
As a result, the Range for Name contents have moved to the end of the “Categories” field. Here is the contents of these two data boxes:
Range for Name: [empty]
Categories: $W$2:$W$366,$C$1
As you can see, “$C$1” is the cell that holds the Name for this data series. (The error is the same for all three data series in the chart.)
I don’t know what’changed. In particular, this spreadsheet document has two sheets, with analogous data on both sheets. The identical chart on Sheet 2 is fine, but I cannot get the chart on Sheet 1 corrected. I can put is back, but every time I do, the “First row as label” check box self-selects, the “Range for Name” field data move to “Categories,” and stays that way. Because the quantity of data are unbalanced, the display of the chart goes haywire.
What is going on?


