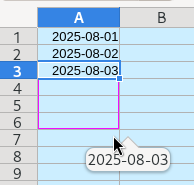
In Libre Office Calc (25.2.3.2 Linux Debian stable), my column “A” has dates like 01.07.2025, 02.08.2025, 01.09.2025
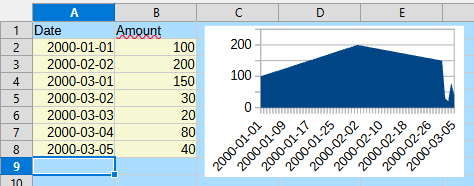
I am using that date column in a chart (on X axis, Y is amount), the data series “Categories” is “$Table.$A$2:$A$999”
999 because i do not want to bother editing chart data each time i add new row.
Problem is that the Calc for unknown reason is plotting the chart the way that it is empty at the beginning (despite my A column is not empty at the beginning, but empty at the end (my last filled cell is A134 and rest is empty) and as a time will pass, i will be filling next cells in the A column and need the chart/graph to consider/plot only filled ones.
How should I edit the "Categories" "$Table.$A$2:$A$999" or what exactly to edit (if you can please describe the steps since i am layman in Calc).
This unanswered question MAY be similar: diagram - Dynamic data range in Libreoffice calc - Stack Overflow

