Is there a way to show tooltips on a chart-series that displays the value on a mouse-hover?
If I hover over a point on a line-series I’d like to display the label and value. If that’s not possible, then at least the value.
Is this possible?

Is there a way to show tooltips on a chart-series that displays the value on a mouse-hover?
If I hover over a point on a line-series I’d like to display the label and value. If that’s not possible, then at least the value.
Is this possible?
Hello,
LO on Win 10:

.
Next one is on:
Version: 7.3.1.3 / LibreOffice Community
Build ID: a69ca51ded25f3eefd52d7bf9a5fad8c90b87951
CPU threads: 8; OS: Linux 5.4; UI render: default; VCL: x11
Locale: en-US (en_US.UTF-8); UI: en-US
Calc: threaded
Just a simple line chart, right? I get nothing, either “as is” or after clicking once and getting draw handles.
.
Version: 7.3.1.3 / LibreOffice Community
Build ID: a69ca51ded25f3eefd52d7bf9a5fad8c90b87951
CPU threads: 8; OS: Linux 5.16; UI render: default; VCL: gtk3
Locale: en-US (en_US.UTF-8); UI: en-US
Calc: threaded
.
That’s Ubuntu 20.04 LTS with an updated kernel.
SimpleChart.ods (14.6 KB)
Tried using VCL=gen.
Version: 7.3.1.3 / LibreOffice Community
Build ID: a69ca51ded25f3eefd52d7bf9a5fad8c90b87951
CPU threads: 8; OS: Linux 5.16; UI render: default; VCL: x11
Locale: en-US (en_US.UTF-8); UI: en-US
Calc: threaded
Exact same system, just with the SAL_USE_VCLPLUGIN=gen prefix. Still no tooltips.
@joshua4
Your sample using
Version: 7.3.1.3 / LibreOffice Community
Build ID: a69ca51ded25f3eefd52d7bf9a5fad8c90b87951
CPU threads: 8; OS: Linux 5.4; UI render: default; VCL: x11
Locale: en-US (en_US.UTF-8); UI: en-US
Calc: threaded
Wow, that is close. I tried again, and I do get the default, yellow tooltips for icons under X11, but no tips for the chart. Intel Gen 2 graphics. No Wayland, not even installed.
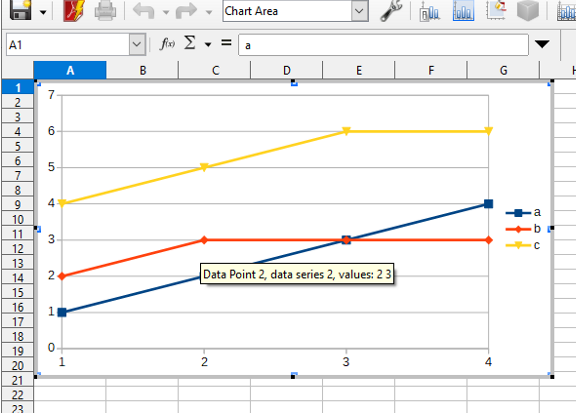
First you must double-click on the chart, or secondary click and choose Edit.
Tested with LibreOffice 7.1.8.1, on Windows 6.3.
OK, I’m in LO 7.2.0.4. I don’t see any option that will enable a tooltip that will fire on a ‘mouse-hover’ over a line-graph series and display the value at the point I’m hovering over.
The options on the context menu are:
Format Wall…
Position and Size…
Insert Titles…
Insert/Delete Axes…
Delete Legend
Chart Type…
Data Ranges…
What I’m looking for is a ‘Dynamic-tooltip’ rather than a ‘Static-label’, which is all I see offered in the context menu.
Am I missing something?
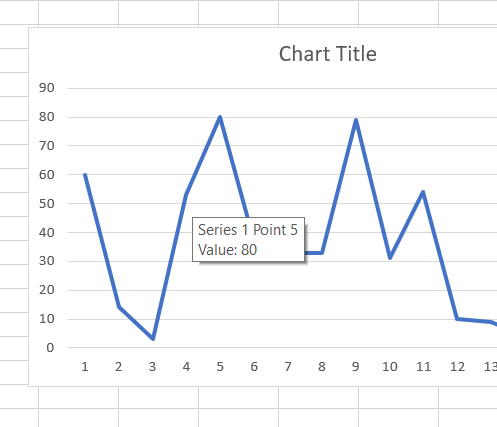
I am pretty sure ( ) that the standard behavior in Excel that looks like this:

simply is not available in Calc.
As you have seen, however, Insert Data Labels and Delete Data Labels are very easily had with a right-click on the data series line.
Since I can only upload one image as a new user, I had to combine my post into one image, since it requires several images. Click to expand to full size:
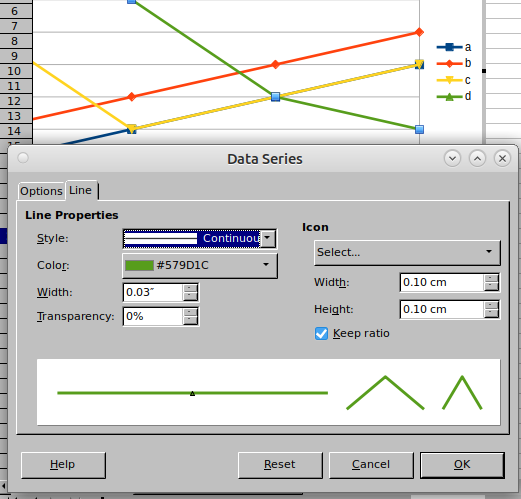
For point (icon) size, edit chart, left mouse click on a line to select, then right click & select Format Data Series
.
On Line tab can change icon size. Do this for each line:

Thanks Ratslinger, that works.
Any advice on re-formating the default ToolTip text?
Does the Calc API have any methods to do that?
You’re getting me closer to an overall solution, thanks again.