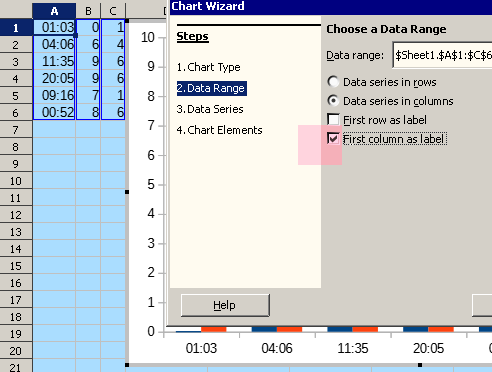
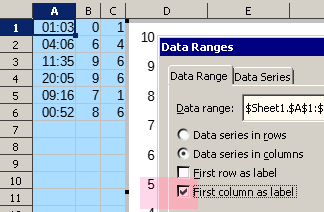
[I have 3 columns of data selected. When choosing the chart wizard, the x axis label is 1,2,3,etc. instead of the data that is in this column. The data that I want to be on the x axis is formatted to time.
I have also changed the format of the data to various other choices ( text, all, scientific) without success. The x axis remains with sequential labels of 1,2,3…48.

or

Thanks so much for your reply. Of course. This was my problem.
1 Like
