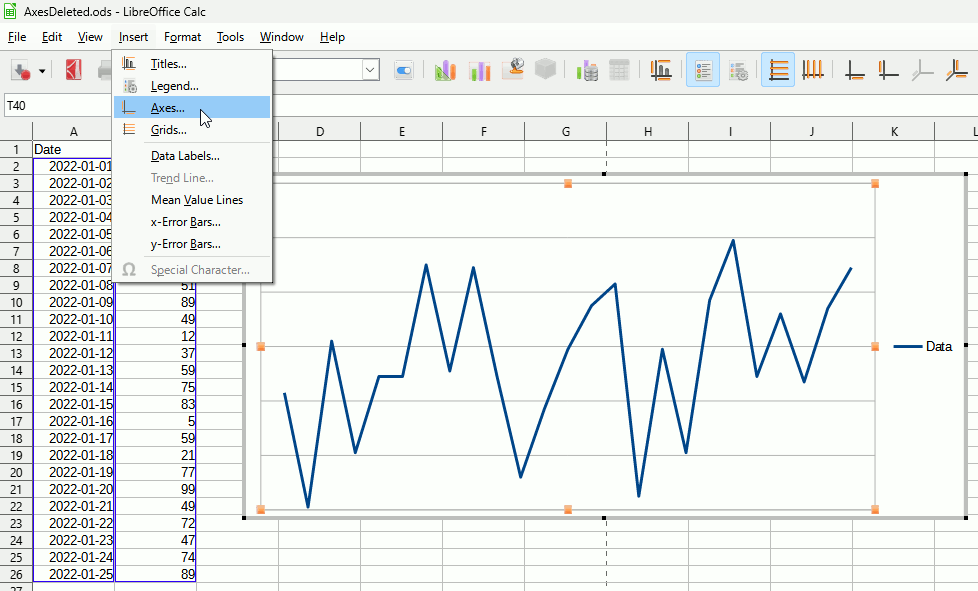
I opened a Calc document which contains a simple two-column series of daily data-- date and number. There’s a chart of that data to the right. Today I opened the document and added a row of new data, and saw the point appear on the right of the chart. Then I noticed the chart had lost its axes, i.e., the textual y-axis labels in the left margin and x-axis labels in the bottom margin.
I’m a new LO user; this .ods started life as an .xlsx but the .ods chart had axes until today. I couldn’t find anything that seemed relevant in the menus or toolbars. The help for Axes - showing begins with
Specifies the axes to be displayed in the chart.
To access this command…
Choose Insert - Axes (Charts)
but the Insert menu contains no Axes command. Its “Chart…” command seems to be only for starting over with a new chart. Is that what I must do?


