Hello,
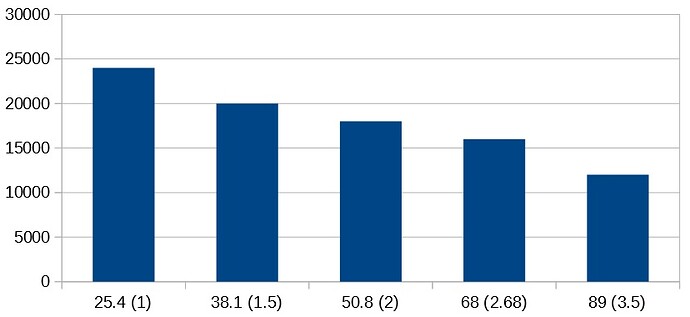
I’m new to LibreOffice and Calc. I have a data range I’ve plotted in a bar graph (see embedded image below), and I would like to display the exact values of the data on the Y-axis, instead of something “proportional” (for example, one of my values is 24319, and I would prefer that that exact value were shown at left, instead of just a bar near the 25000 major-axis line mark of the Y-axis).
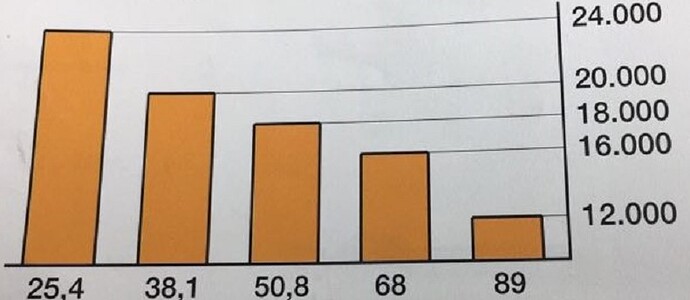
My goal is to display something similar to the chart below. Hopefully this is helpful.
Thanks in advance for your help.


