Calc - Export chart as image --> can't get rid of chart border

In Calc “Format chart area\Borders\Line Properties\Style = none”. Then I “Export as image”. When I open the image (either png or jpg; opened with Irfanview) a thin border is still present. The border is present when uploaded to my website with Dreamweaver and viewed either with Chrome or Edge. In Calc I have also tried setting the border to white and/or setting transparency to 100% and/or setting the border line width to zero.

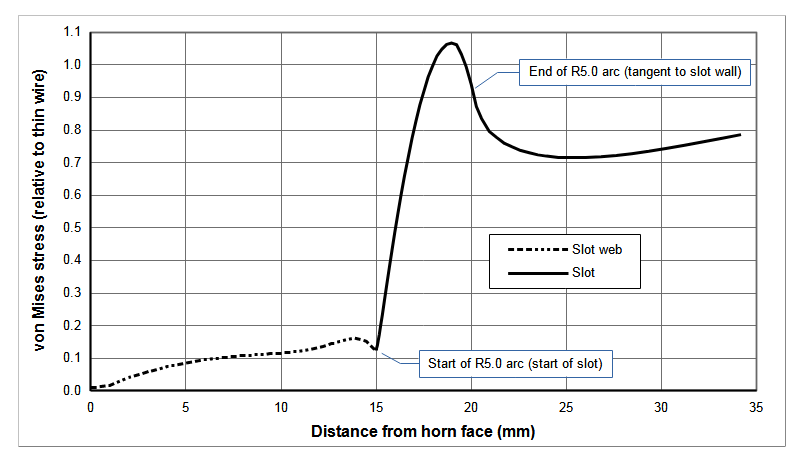
I made the png large enough to show the border which is the rectangle whose one side is just below the “Distance from horn face (mm)”. Otherwise, the border would have been coincident with the edges of the png and wouldn’t have shown up. I want to eliminate this thin gray border.

Here is the exact image that was exported from Calc –

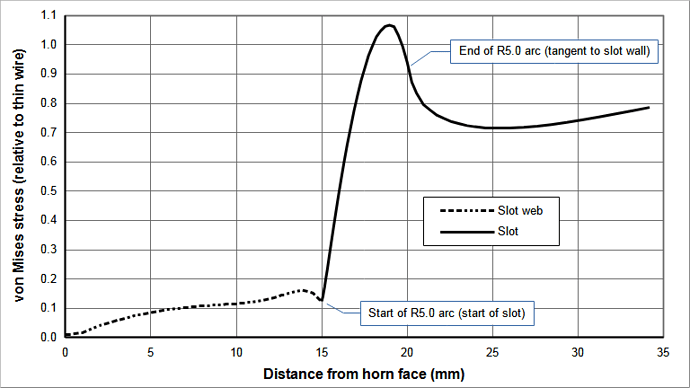
Also, here shows the problem in my actual website –

website problem images

Here shows proper images without borders that were created with LibreOffice 4. (For some reason the link option in the command bar above wouldn’t let me insert a second link.) –

http://ultrasonic-resonators.org/glossary/bessel1_dict.html

LibreOffice 7.0.6.2

Thanks,
Don C.

[Edit to show image - please use Slide icon to add images]

There is no border around the png; there is a border inside the png.

The border is present

Do you say of the gray line below “Distance from horn face (mm)”?

I can’t see any border in my test. LO 7.0.6.2.


Add Answer is reserved for solutions. Please, click edit below your question to add more information.

Earnest Al – re “I can’t see any border in my test.” Did you create a chart and then “Export as image”? If so, what settings did you use for “Format chart area\Borders\Line Properties”?

Re edited question. So that isn’t the png exported from Calc? If the outside border doesn’t show up when posted here then it probably doesn’t exist. Where is the png exported from Calc?

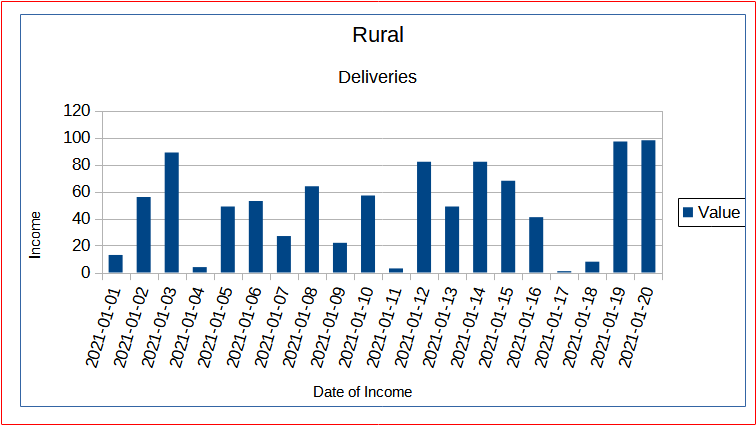
The deliberate red border on the png in my answer is co-incident with the edge of the png and shows up fine.

But I don’t want the red border to show up – I don’t want any border.

I tried your suggestion as best as I could understand. When I created the rectangle I set the fill to None and the borders to None. I then double clicked on the chart and pasted rectangle. I next expanded the rectangle out to the edges of the chart (coincident with where the chart border would be). I then exited from the chart, then “Export as image”. However, the light gray border was still there.

Also see my again edited question which shows the desired result from LibreOffice 4.

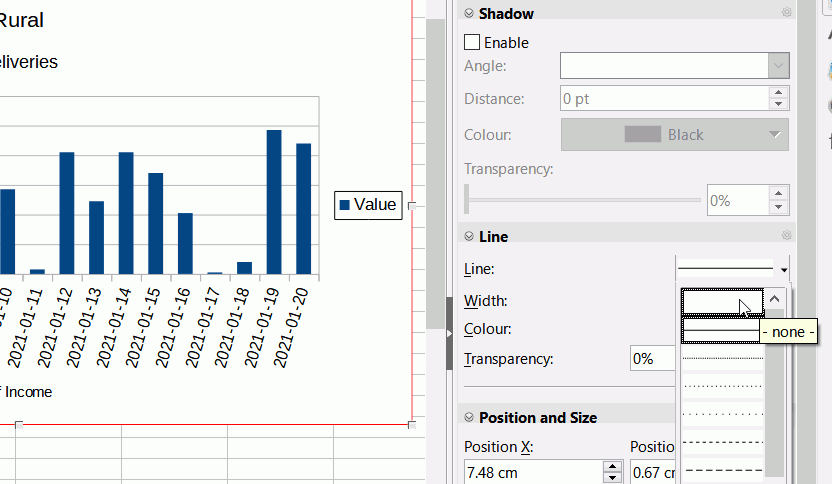
Earnest Al – Thanks. Your last suggestion (change Line Style to None) worked. (The shadow was never enabled.) Also, the chart now displays properly within Calc without the border.

I’ll credit your answer. But first, what is the difference between using the Sidebar versus double-clicking the chart, then “Format chart area\Borders\Line Properties\Style = none” which I originally tried? Is this a bug?

Why is the border Line Style set to Continuous? This is not the default style for charts. Am I wrong?

You can apply the border to most objects. The chart is not in edit mode so it is just an object like an image.

LeroyG – I just created a simple XY-scatter chart with the chart wizard. There isn’t any option for applying a border to the chart so it doesn’t have a border by default. When I double-click the chart and then “Format chart area\Borders\Line Properties” it shows “Style = none”. If I set the style to “continuous” then a border appears. If I reset it back to “none” then the border is removed. However, in my attempts to remove the border this didn’t have any effect. Thus, it must be as Earnest Al explained – that the border was applied to the chart object, exclusive of the actual chart properties. What I don’t understand is how I could have accidentally done this. I wasn’t aware of the Sidebar until Earnest Al pointed it out so it couldn’t have happened by that means.

Also in Format > Object > Line.

Handy way to get a two colour border, 2mm wide red and blue border looks startling.

I can recreate a similar situation, down to the “border” not being exactly centred. To fix the problem I just created it is just a matter of editing the graph, selecting the rectangle and deleting it.

  1. In Calc I draw a rectangle using the drawing tools, set the fill to None, then Ctrl+X.
  2. I edit my graph and paste the rectangle into the graph and arrange it
  3. Exit edit mode. then Export as image

In the image below I have set the Chart Area borders as red to show where they are, my inserted rectangle is the default blue colour.

2021-07-06 03:28 UTC

OK. Now that it is established that it is not an issue about a border inside the boundary of the png, which is what original image appeared to show, here is another possibility.

  1. Select the chart.
  2. Open the Sidebar, select Line and change Line Style to None, untick Enable for shadow if ticked.