I’d like to set start of x axis to 29 and start of major grid and labels to 30. Is it possible?
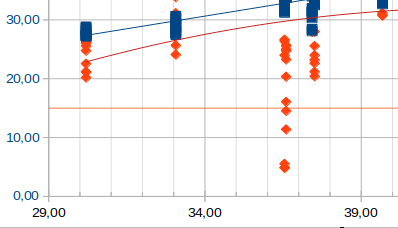
If I set x axis start to 29, grid and labels start at 29 too, like in picture:

I am using Libre Office Version: 7.4.5.1, Build ID: 40(Build:1)
CPU threads: 4; OS: Linux 6.1; UI render: default; VCL: gtk3
Locale: bs-BA (en_GB.UTF-8); UI: en-US
Calc: threaded
Could you share a sample file to test?
Thanks for sharing the version information.
As the question is concerning LO Calc chart I think that data do not matter but I will try to make an example.
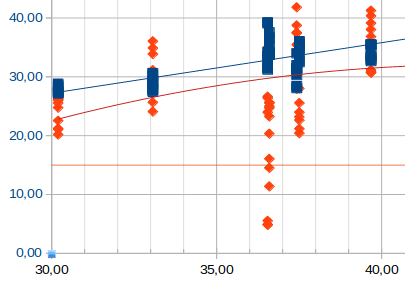
I want to get Major Grid and it’s labels like this:

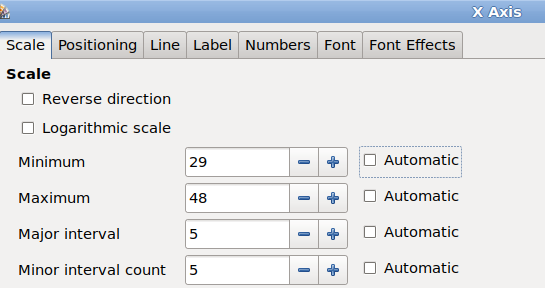
with x-axis starting at 29, as is in the picture of my first question and settings:

Please upload a sample spreadsheet file, not a picture of it.
This is (almost) the result I want to achieve. Almost because the chart object are moved to much to the left and I want them centered.
Try to scale the X axis manually (of the second sample graph) with an appropriate maximum value, what come the “centered” view.
Or you can use a tricky third graph line as a “virtual X axis” with the showed X values as labels. (X values: 30, 35, 40, 45; Y values in the column “E”: 0, 0, 0, 0,). And switch OFF the original X labels.
That is a neat trick I’ve been using in some of my other charts. I didn’t use it here just because I was hoping that there are some grid settings separated from axis settings, which I just can’t find. BTW with this trick I should make “virtual major grid” also.
Thanks a lot!
