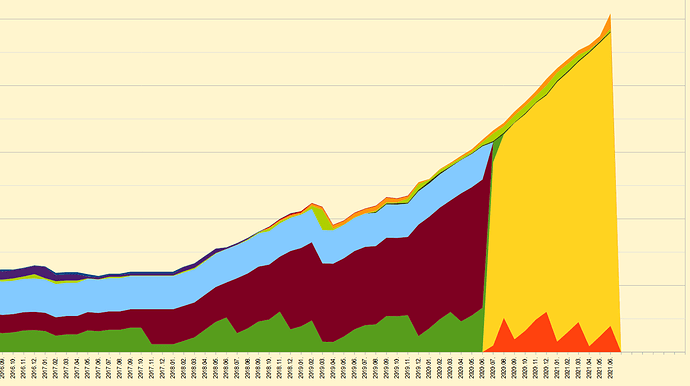
I have a stacked area graph that looks like this:
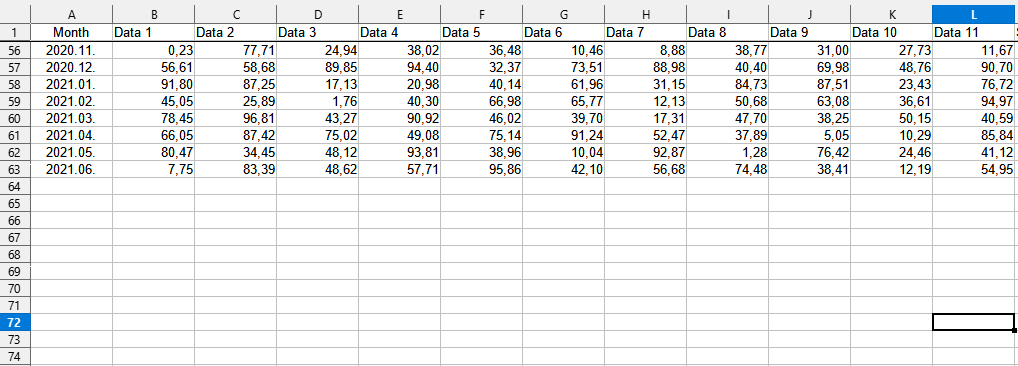
And the raw data (replaced with random values so it won’t correlate with the original graph):
Problem:
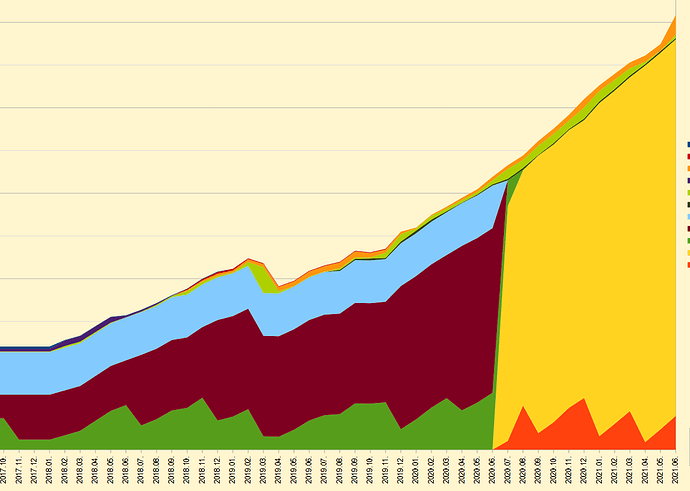
In value range, I selected A1:L70, so when the next month comes the graph will update itself. However the empty lines are still shown on the graph. The graph should look lite this in my opinion (which works in Google Sheet btw):
But I can only achieve this by modifying the range so it only includes filled out rows. However I do not want to do this every month (or more often if I need to do a stacked area graph for daily values…) The cells in row 64 and so on are totally empty, no formulas whatsoever that return “” or something else. How can I achieve the second graph look?

