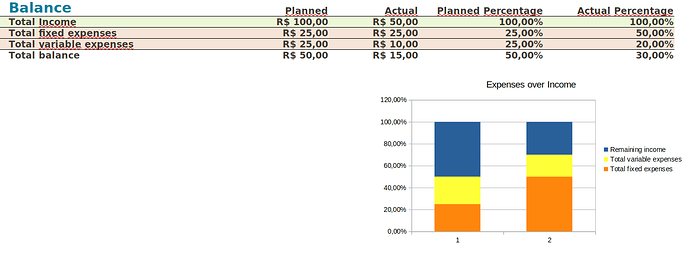
I have the following spread sheet.
The chart is showing the relative percentage of each data value with regard to the total of its category. But I want it to show the percentage over Total Income’s value. So the chart shown above would have both bars filled with 50% yellow and 50% orange, since the total income is taken in equal parts by the expenses.
I think that maybe in this desired chart things would get weird if total expenses value overcomes total income value (e.g.: total fixed expenses is a value greater than 25.00). So if it’s not possible to achieve this desired chart as a Percent Stacked chart, is there some other way to get it without percentages, but still with stacked values?


