Calc: Plot data over irregular spaced dates

Hi,

I have a dataset with numbers related to a sequence of dates that are irregularly spaced. Now I like to plot the data as lineplot. I like to see the dates along the x-axis not evenly spaced, but spaced in correspondence to their actual values in the dataset

As an example, the dataset looks like this:

12/03/23	3
12/04/23	5
12/15/23	9
12/20/23	3
12/26/23	10
12/28/23	8

I can easily create a lineplot from this. But whatever I try, always the dates are arranged evenly spaced along the x-axis. But obviously in the dataset as shown above they are not evenly spaced.

Unfortunately I did not find any solution for this so far.
Does anyone know, how I can plot the dates as they are along the x-axis?

Thank you for your help.

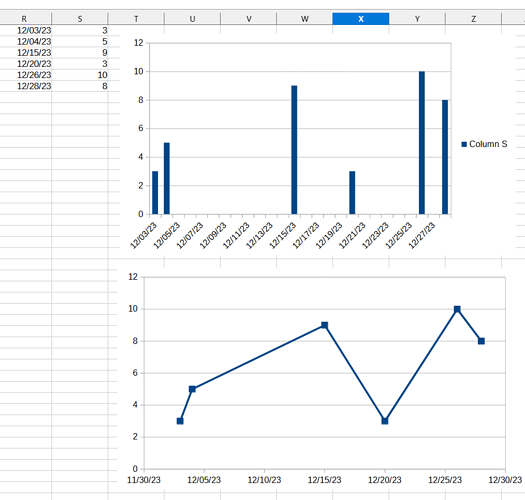
I created two charts which show irregular spacing. I did nothing special, just a bar graph and an X-Y graph.


For this, I selected the range (in the example above R1:S6) and used the menu Insert > Chart.

Thank you for testing. Actually I just managed to get the same result.

It appears, that due to some reason when setting the date cells to format “date”, a ’ is added in front of the date, but the ’ is only seen in the “equation field”: There the date is shown as '12/28/2023, while within the spreadsheet the date is shown as 12/28/2023.

If I manually remove the ’ and then again try to create a plot, the dates are arranged along the x-axis according to their actual values. Strange…

See How to convert number text to numeric data

2 Likes