I’m using LibreOffice 4.3.4.1 in Windows 7 64-bit.
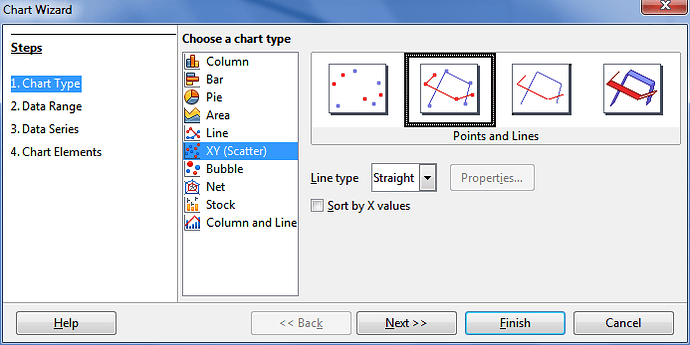
I’m trying to create a simple line graph (using XY Scatter graph) of an account’s balance vs. the date.
I have 2 columns of data: A is date, B is account balance.
I have the cells in the date column set as type date.
I have the cells in the balance column set as currency.
When I click on the Graph Wizard, I tell it to create an XY Scatter graph.
I select the range of data, and I get a graph with no data points and no line.
Any idea what the problem is?


