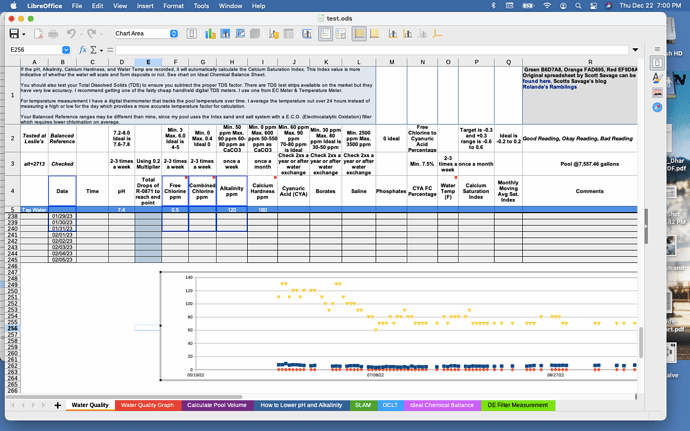
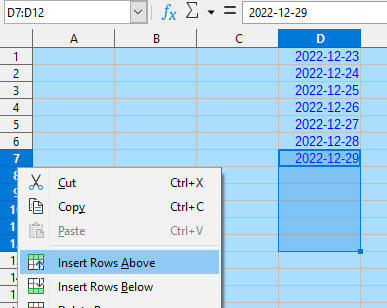
I have a workbook that I keep records of data collected from our pool. On sheet one I have the actual data collected from the tests I run on the water quality. On two I have three charts like this.
chart
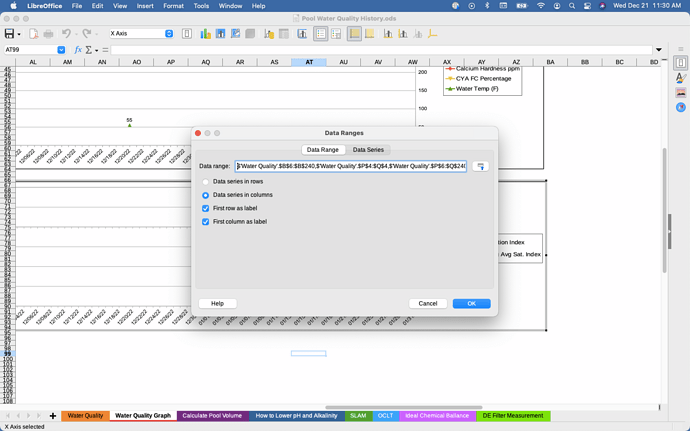
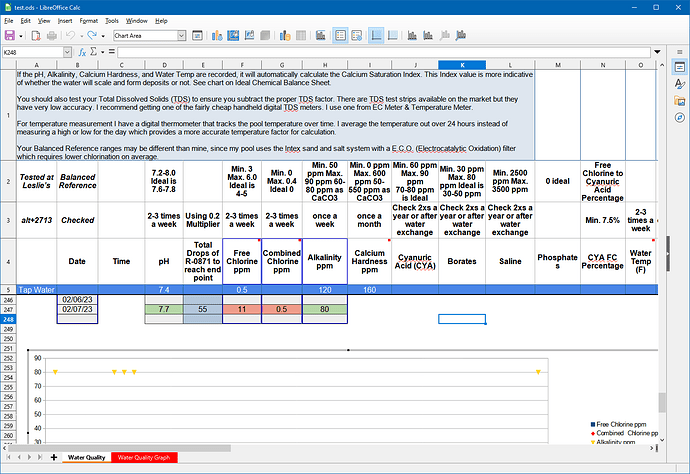
When adding to the date column on sheet one the charts do not populate with the added dates. I have to edit like this by changing the last cell in the column.
When February comes around and I add another month to the column I will have to manually change the last cell of the date column to the chart.
Here is my question, can the x axis in sheet two with dates be linked to the column in sheet one with dates to populate automatically when adding cells and dates?
Version: 7.4.2.3 / LibreOffice Community
Build ID: 382eef1f22670f7f4118c8c2dd222ec7ad009daf
CPU threads: 4; OS: Mac OS X 11.7.2; UI render: default; VCL: osx
Locale: en-US (en_US.UTF-8); UI: en-US
Calc: threaded

