I have some scatter plots that contain data that goes from -1.5 to 1.5 on the x axis. We would like to extend the x axis out to about 1.7 in each direction in order to show where our data ends. We would also like to have major interval marks every 0.5 on the x axis.
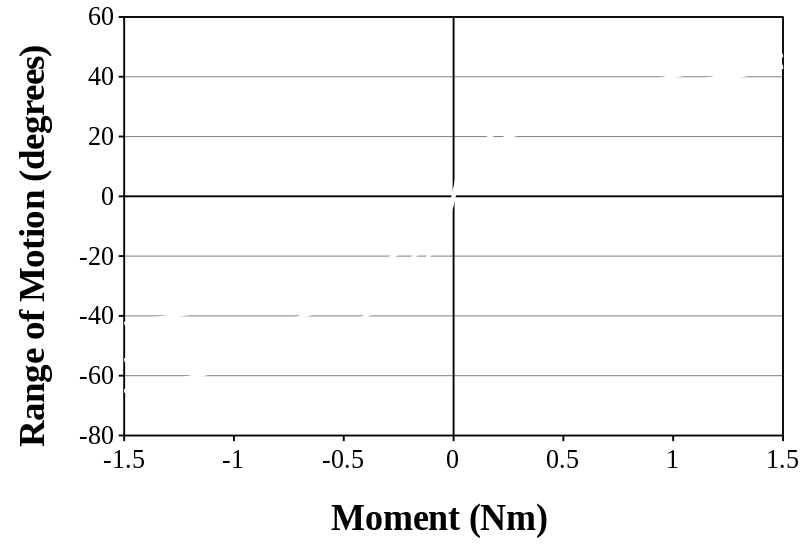
If we set the x axis to go from -1.5 to 1.5, the figure looks like this (I’ve whited-out the data because it’s still pre-publication)
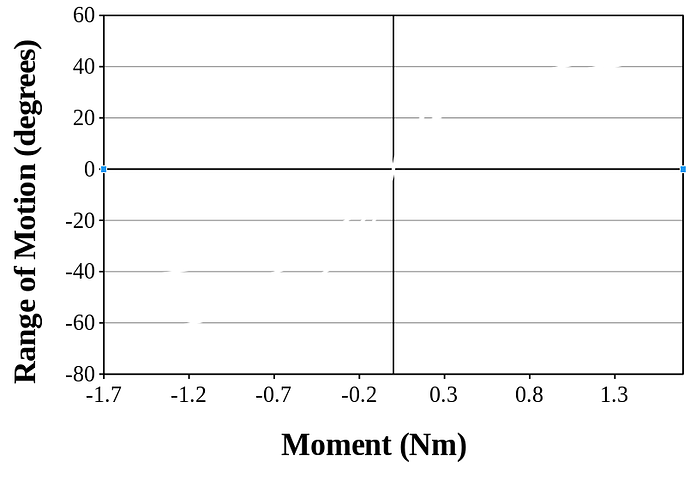
If we set the x axis to go from -1.7 to 1.7, the figure looks like this
The problem is that the major interval marks always begin to count from the left side of the figure. What we want is to have interval marks exactly like the first image (at -1.5, -1, -0.5, 0, … , 1.5), but have the graph extend out to 1.7 in each direction.
Is there any way to force the interval marks to start at x=0, and extend outward from there? If not, I’m going to have to redo all of my figures in another program :\
Thanks!


