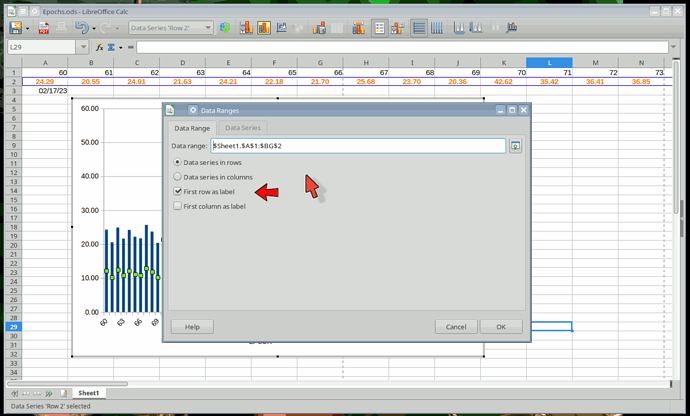
hey guys
How do I edit the displayed values for the x-axis please?
The current values start at 1 and finish at 60
I want them to start at 60 and finish at 120
when I
Epochs.ods (22.3 KB)
left click on the x-axis and select Format x- axis then choose Scale in the Edit mode I am offered Automatic, Text and Date nothing else?
Unticking Automatic does not present any other options and it is only if I select date that I am able to see the Minimum, Maximum and automatic options which is of no use?
What am i doing wrong please?
Set a specific range as the labels. You already have the values 60 - 120 in row 1 so extend your range to include row 1 and set the first row as labels.
Epochs.ods (27.5 KB)
You would be better storing your data column wise as there are over a million rows compared to 16384 columns.
2 Likes
robleyd thank you, so simple when one knows how to do it.
I have stored the data in columns as you have suggested.
Much appreciated

