Chart Axis Display units

On a chart, whenever you I have values in the thousands or something similar (eg values from 1000, …, 9000) I would change the base of the graph to show on the top the base (e.g. 10^3) that would make the values in the axis appear with way less zeroes (e.g. 1, 2, 3, … 9), how to do the same with LibreOffice?

I understand there is a log option, but thats different on what I want, even if similar.

In excel this feature is called Display Units

Please attach a sample file, reduce the size as much as possible without private information,
and paste the information in Menu/Help/About LibreOffice, there is a copy icon.

Cf. tdf#68354

2 Likes

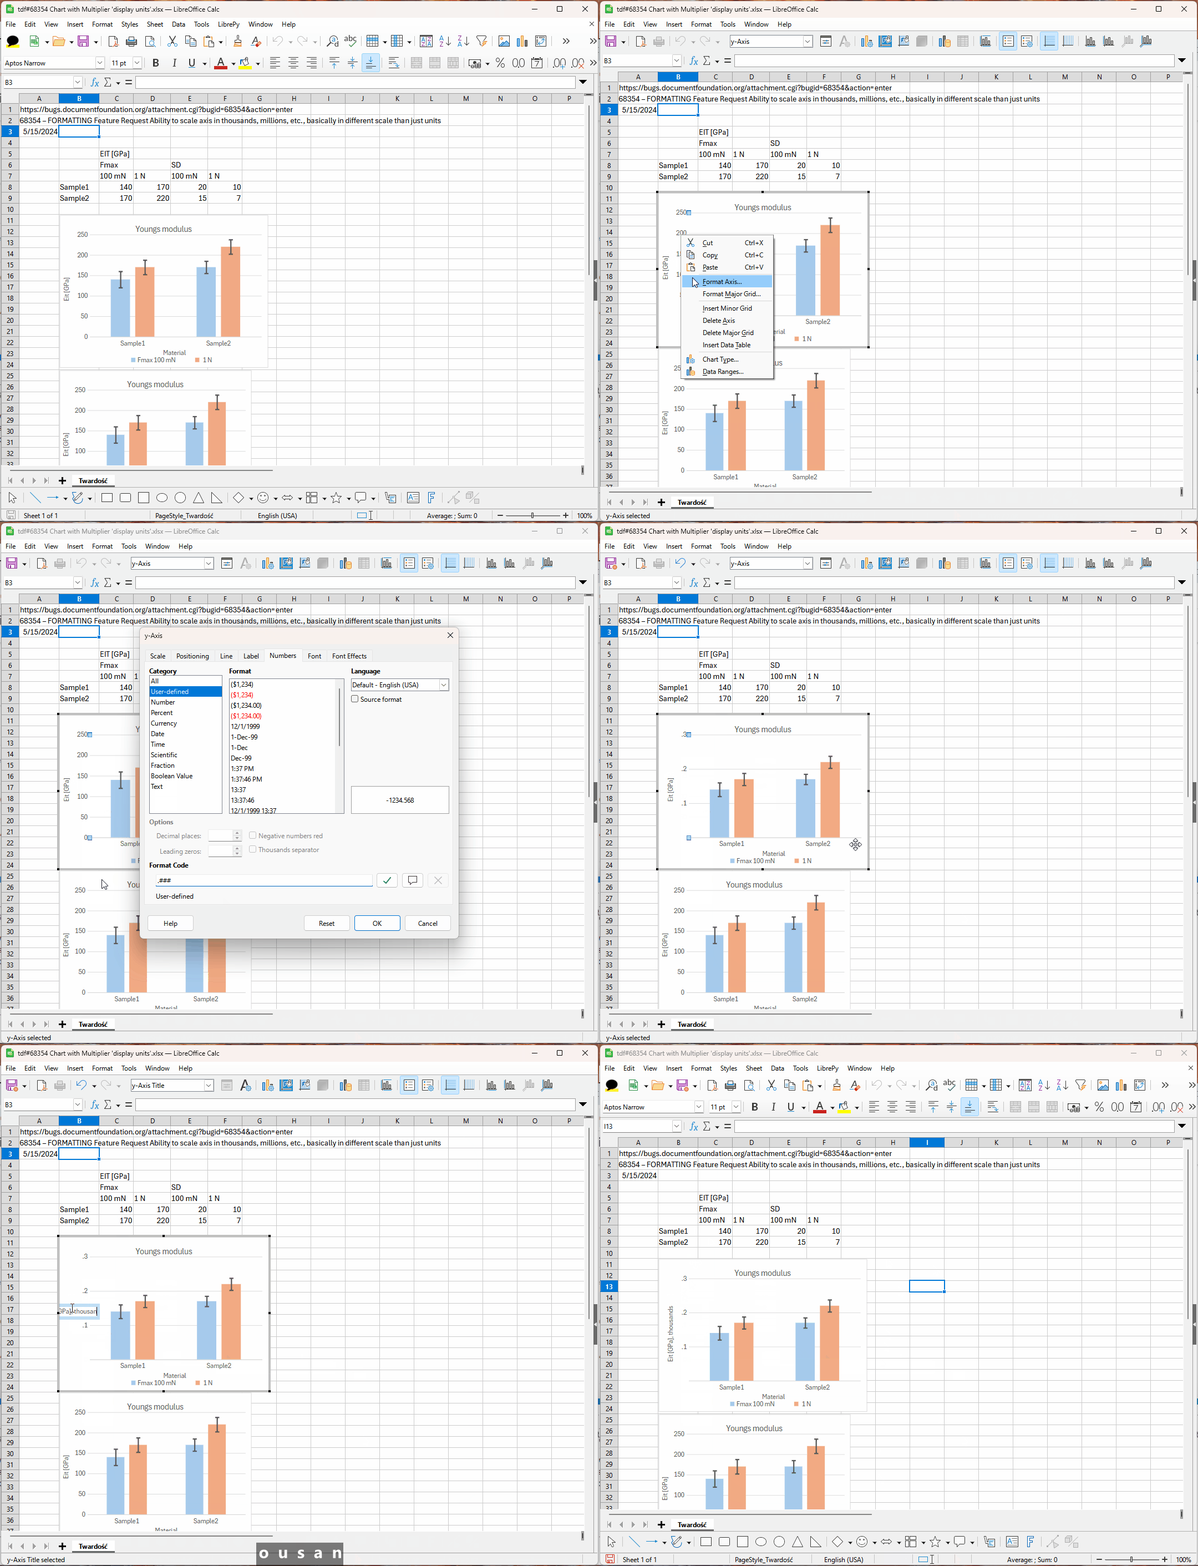
The related feature request is already linked by @cwolan. The existing way to do that manually is: format axis, and define its number format to the necessary scale, and shown in help.

thousands

3 Likes

Even if its not a feature of libre office im so glad you provided a workarround, Thank you!