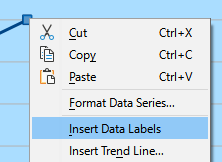
I can only see chart x and y labels when I double click the chart. If I select a cell(s), the labels disappear.
How do I fix this?
I’ve tried the file as ods and xlsx and same issue
It is not clear to me, what you mean by “chart x and y labels”. Could you please attach a screen shot of such labels?


