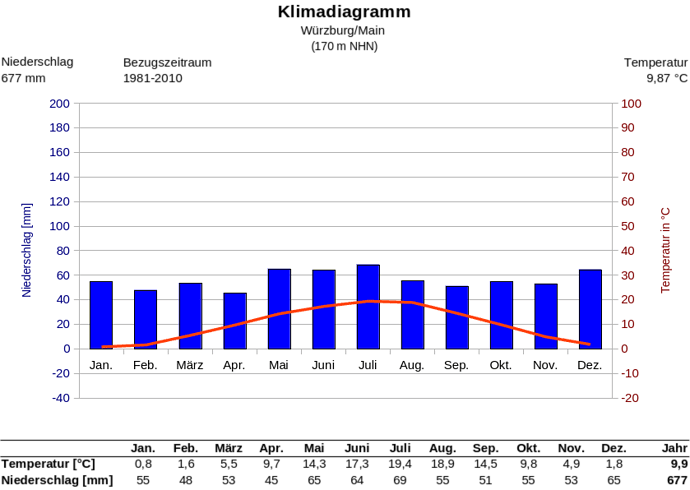
I have set up a database and a calc sheet to produce climate diagrams, similar to Walter-Lieth-diagrams. That way, I can generate them half-automated for different weather stations. For the report I’m writing I’d like to have the descriptions in the chart as serif, specifically Linux-Libertine, for the presentation in sans-serif, specifically Nimbus Sans (Helvetica clone). Usually, everything in LibreOffice can be styled by styles, so I was surprised, that in charts, everything is hard coded. Did I miss something, or is the only way for me to change the font for the whole chart to edit every chart element on it’s own?
Haven’t missed anything, it’s a feature request that has been outstanding for some time. It does have a high priority but it is a considerable piece of work to implement.
If it is something you do regularly some people have found it easier to setup a document with chart types already formatted. Then they copy and paste them into their new document and simply modify the data ranges to accommodate the new data. Once you’re used to it, it is easier than adjusting all the formatting on a new chart.
2 Likes

