I’ve been searching the topics and I can’t seem to figure out how to do this. I have a simple two column spreadsheet and I want to create chart that where the bars are clustered by month.
The spreadsheet is in the format of
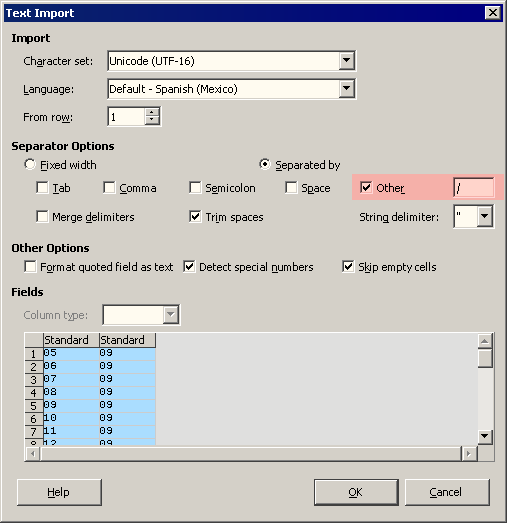
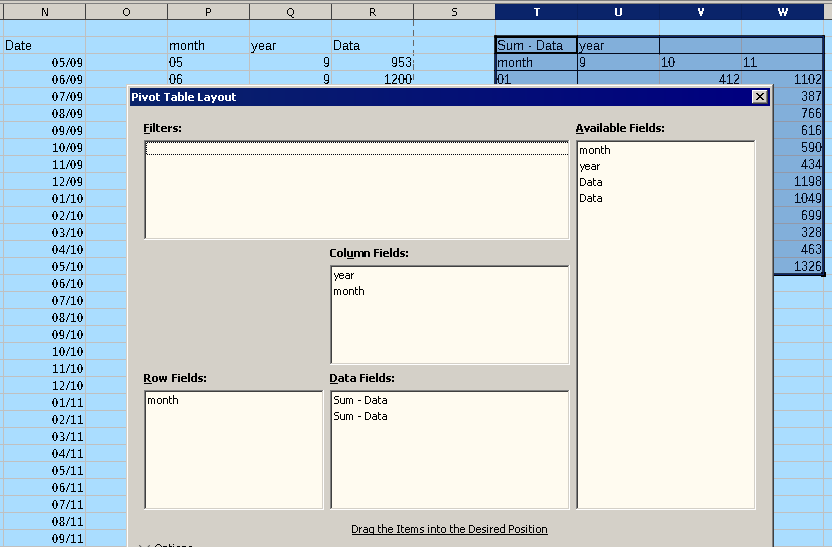
mm/yy data (the mm/yy column is in date format)
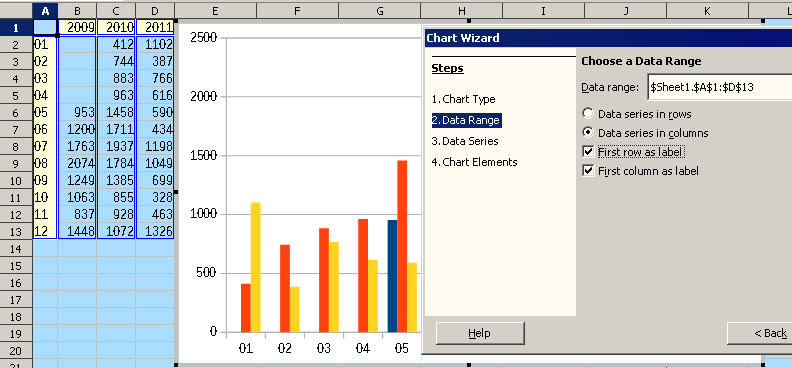
and I simply want a bar chart with the months along the x-axis and in the first group I would have 01/09, 01/10, 01/11. the second group of bars would be 02/09, 02/10, 02/11 and so on. Is there a tutorial or instructions on how to do this seemingly simple task?
05/09 953
06/09 1200
07/09 1763
08/09 2074
09/09 1249
10/09 1063
11/09 837
12/09 1448
01/10 412
02/10 744
03/10 883
04/10 963
05/10 1458
06/10 1711
07/10 1937
08/10 1784
09/10 1385
10/10 855
11/10 928
12/10 1072
01/11 1102
02/11 387
03/11 766
04/11 616
05/11 590
06/11 434
07/11 1198
08/11 1049
09/11 699
10/11 328
11/11 463
12/11 1326


