Hello, I wanted to ask for assistance with my chart.
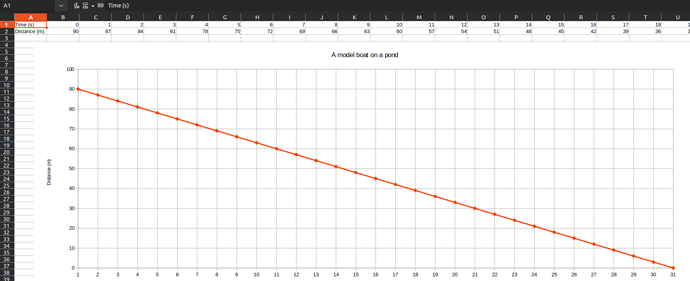
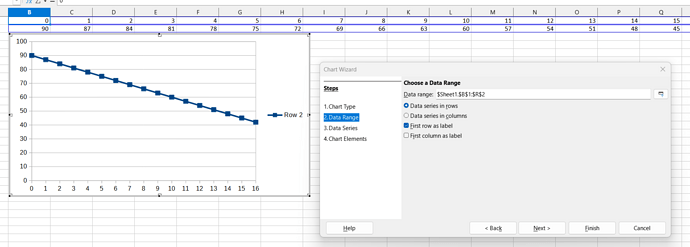
Even though my data set starts with zero the chart isn’t showing it. In fact it shows 31
even though I don’t have 31 in my data set !
Zero is displayed for the y axis but not for x axis. There’s good change if the zero was included number 31 would go away.
Your assistance is appreciated !


