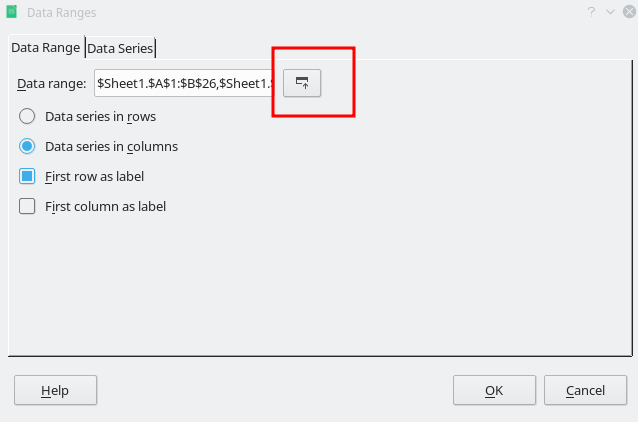
The Calc user manual says that to add a data range for a chart from an additional region, “use a semicolon as a delimiter between ranges. Enter the first range, then manually add a semicolon at the end of the text box, then enter the other ranges.”
When I go to Format > Data Range, add a semicolon in the text box, and select an additional range, the Data range box turns orange. OK is grayed out and clicking the Data series tab does nothing. The only option appears to be to select Cancel.
The manual also gives directions for adding to a data series (as opposed to data range) from an additional region. In this case, we are told to hold Ctrl while selecting the additional data. No matter how I try to do this, I get the same result: the Data series text box turns orange and Cancel is the only active option.
How can I select unconnected data to add to either a data range or a data series?

