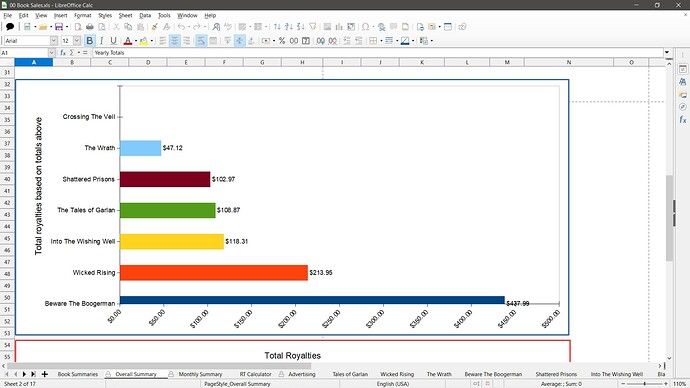
I’ve asked this before and haven’t gotten an answer. I thought I’d try again. I have a spreadsheet that has a number of charts, reading data from other worksheets, and I have this one sheet protected. I save the charts in exactly the way I want them to look, but every time I reopen the spreadsheet, the chart’s look has changed. See the images below. I’m trying to find out if there is a setting that I need to change or what, but it is getting aggravating. If I set the chart below to be a pie chart, it really gets screwed up, to the point of not being readable. As you can see, the bars on the chart shift downward, cutting the bottom bar in half.
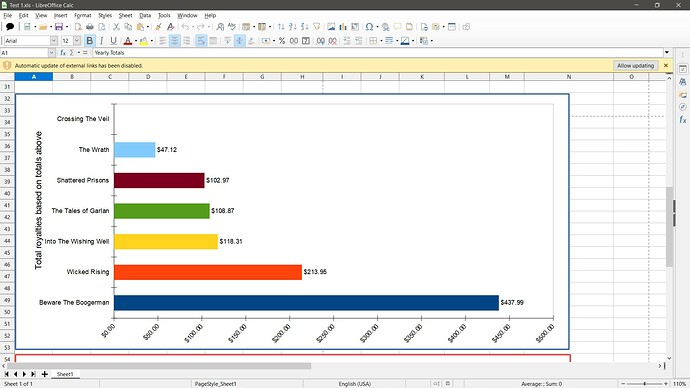
Chart the way I want it to look:
Chart the way it looks after I open it:
I’ve also attached a copy of this one worksheet. Any help would be appreciated. Thanks.Test 1.xls
And I am running the latest iteration of LibreOffice in Windows 10 Home.


