I am creating a chart with a few points. The resulting chart show no lines between the points. I would expect them to be there. Appeared at former versions but tested now on LibreOffice 6.4.
I would expect them to be there.
… but you don’t provide any substantial information why you expect that. You don`t mention your operating system, you don’t provide your LibreOffice version. You don’t tell us what chart type you are using, which data ranges used, which options selected and much less uploaded a sample file. All you did: You expressed an expectation … (which finally isn’t a question).
Further to the comments by @anon73440385 and assuming a lot of information and in the simplest case, double-click on your chart and then right click on it to get the little menu, then choose Chart Type. Make sure you select an option that includes lines between the points. Works best with X-Y (scatter) charts but usually also with Line charts.
These could happen with Chart Types Line and XY (Scatter).
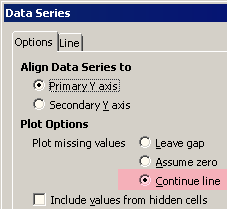
Plot missing values: Once the chart is created, Edit the chart (double click on it),¹ open the Data Series dialog (double click in a chart line),² and check the option Continue line (in the Options tab, below Plot Options), OK.

¹ Also can select the chart, choose menu Edit - Object - Edit.
² Also can select a chart line and choose menu Format - Format Selection… - Options tab.
See more LibreOffice Help on Chart Wizard - Chart Type) and Data Serie Options.
Tested with LibreOffice 6.4.7.2 (x86); OS: Windows 6.1.
Add Answer is reserved for solutions. If you think the answer is not satisfactory, add a comment below, or click edit (below your question) to add more information. Thanks.
Check the mark (![]() →
→ ![]() ) to the left of the answer that solves your question.
) to the left of the answer that solves your question.
If the answer helped you, you can mark the up arrow (![]() ) that is on the left (to vote, you need to have karma of at least 5).
) that is on the left (to vote, you need to have karma of at least 5).
If you do not have sufficient data to automatically ploting in chart, you can not “double click” in a chart line, right?
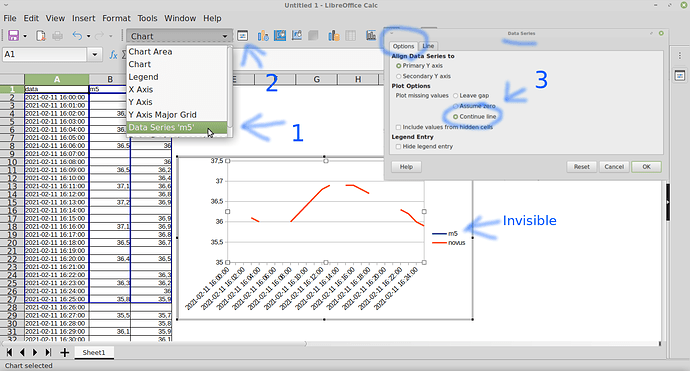
The problem: you line is invisible/hidden. You need to select it using toolbar options!
Solution:
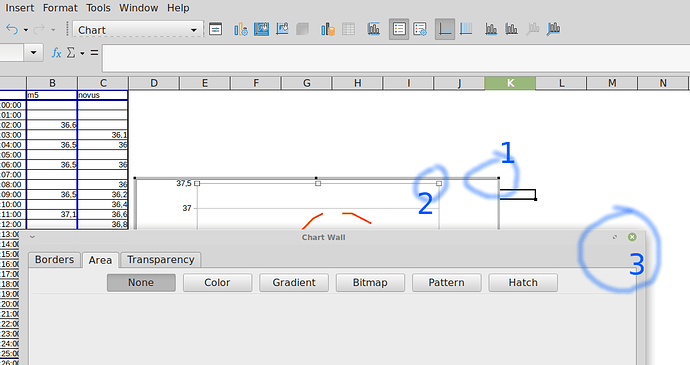
- Double click you “chart”
- Double click your “chart wall” (plot area)
- Close the “Chart Wall” that appears:
So you need to pay attention to a toolbar dropdown option, that show your chart elements.
There you can:
- Select/choose your “invisible” data serie
- Click on the “Format Selection” button beside
- and finally check the “Options → Continue Line” radio button:
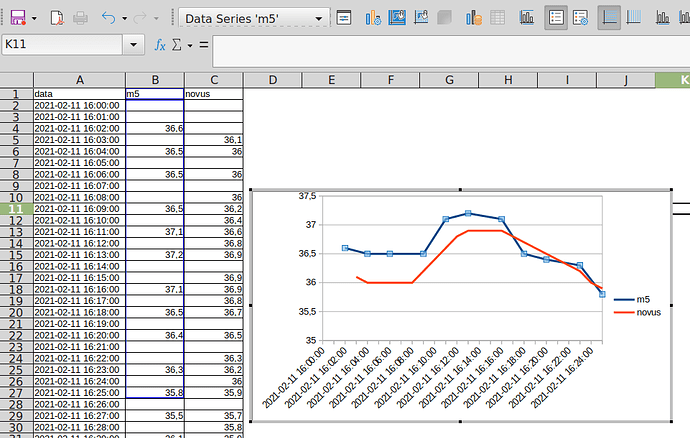
Ready:


