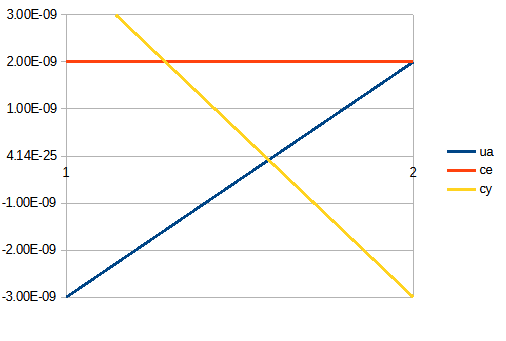
I have a line chart with small y-values. I’d like my chart centered at 0, with the scale max at +3e-9 and min at -3e-9. But under this circumstance the y-axis center is at 413.59e-27. If I change the max to +4e-9 and min to -4e-9 then the center is at 0. If I use max at +2e-9 and min at -2e-9, the center is at zero. But, when set to +/- 3e-9 it’s not zero, it’s 413.59e-27.
Yes, same issue with the test file.

