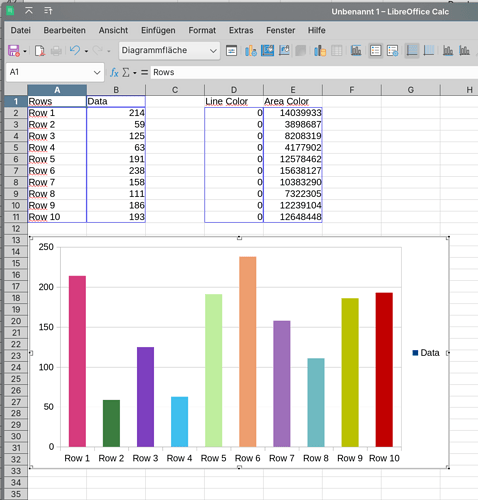
I want to make a chart. I specify the line color and the area color. However, only the area color gets shown. There are no lines. How do I fix this?
Version: 24.2.4.2 (X86_64) / LibreOffice Community
Build ID: 420(Build:2)
CPU threads: 8; OS: Linux 6.9; UI render: default; VCL: kf5 (cairo+xcb)
Locale: de-DE (de_DE.UTF-8); UI: de-DE
Calc: threaded
chart.ods (22.1 KB)


