Closer gridlines

I have a chart, Scatter Plot, and gridlines are placed by default on each of the axises’ data points. I want to make the grid much finer than this, so I can take a ,more accurate extrapolation without just guessing between the data points.

I have read some offered solutions, but if I tried to follow the instructions, things looked completely different in menus and DBoxes.

Any help much appreciated.

@REALOldNick: Please upload a sample file.

  • Edit the chart, then
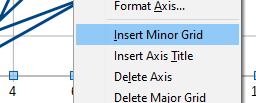
    • secondary click in the X-axis, and select Insert Minor Grid;
      or
    • select menu Insert - Grid, and mark [x] X axis under Minor Grids.
      imagen

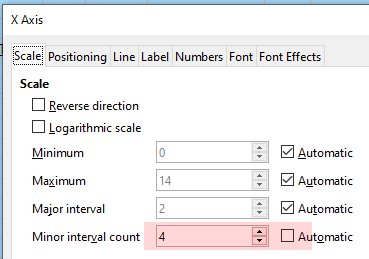
Maybe you would like to set a greater value to Minor interval count, so more lines are displayed.
imagen

3 Likes

Ahah! It was the Scale that I had missed. Thanks very much.

1 Like