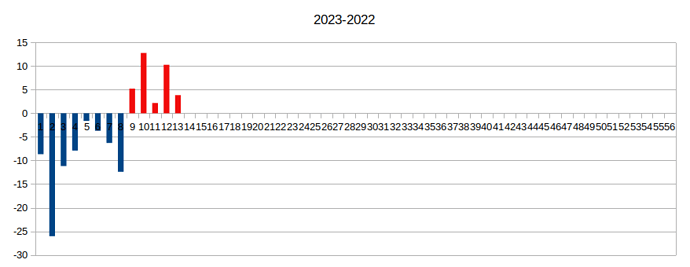
Conditional formatting colours in a diagram

Is there a way to conditional format the colors in a bar diagram? E.g. when the values are positive, then colour1 if they are negative, then colour2. I now change the colors manually by editing the points in the diagram itself.

LO Version: 7.3.7.2 / LibreOffice Community
Build ID: 30(Build:2)

Not what you were asking but a similar effect in less time and no extra columns. Select range and click Format > Conditional > Data Bar
Maybe click button More Options and change fill to colour rather than gradient

Pull the data into different Columns

positive_or_negative.ods (18.0 KB)

Thank you. This is easy to handle and allows me to do some extra calculations on the positive and negative values.