Conditional formattinhg databar axis none unintuitive display

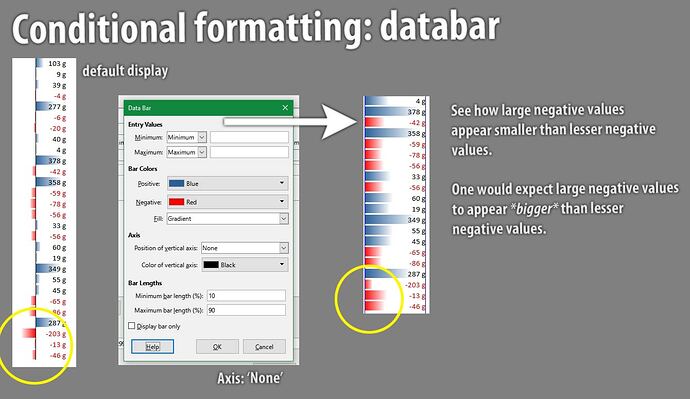
The default databar display (conditional formatting) shows negative values in red, with the larger (absolute) negative values displayed larger than smaller values.

However, if I change settings of Databar Axis to None, larger negative values appear smaller than smaller values.

Why is this? Am I doing something wrong? Is there a way of fixing this?

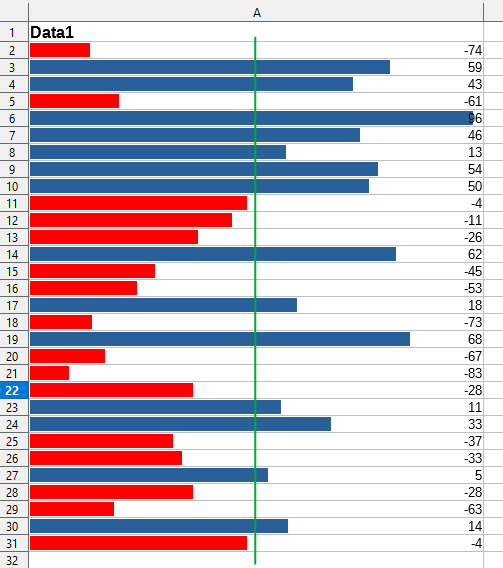
The way I see it is that the axis is now invisible but is somewhere in the middle as shown by green line I added manually in image below. It might be simpler without gradient fill

It isn’t a clear representation so I would normally go for the default layout.

Ok I can see that your interpretation of Axis: None makes some sense, inasmuch it’s possible to interpret visual display according to it.

I agree with you there! In fact, I would say that the representation makes absolutely no sense if the point is to clarify the data in a visual way. Axis: None obscures the data.

The length of the bar should indicate the magnitude of the data; it does not. We are supposed to guess where the axis is (in the middle somewhere) and then try to ignore the length of the bars, instead figuring out the magnitude of the data based on how far we guess the end of the bar is from this imaginary axis! Crazy.

I like the idea - blue bars indicating magnitude of positive values, red bars indicating magnitude of negative values. However, current implementation is - in my opinion - broken and worse than useless.

Then you should file an enhancement request, How to Report Bugs in LibreOffice - The Document Foundation Wiki

Ok. Thanks for your help. :grinning:

BTW Excel 2010 does it the same way if Axis is set to None.