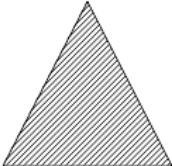
I made the following figure using the Isosceles triangle tool:

As you can see the border lines are all the same color: black. Is there a way to set a different color for a side? for example the two equals to green or one green and another blue?

I made the following figure using the Isosceles triangle tool:

As you can see the border lines are all the same color: black. Is there a way to set a different color for a side? for example the two equals to green or one green and another blue?
The edges of a polygonal shape aren’t separate objects, but parts of a line object.
If you want to get one (some() of them shown with different attributes visually, you need to create the respective edges one by one a line objects. To get the endpoints exactly in the needed positions, you should enable the appropriate snap options. Having drawn the needed lines you may group them together with the original polygonal object. You may also set the line property of that object to ‘none’ … Lots of things you can do.
‘Draw’ is a component you can learn a lot about by playing.
(To have access to the full range of features for drawings, you should probably do such things in ‘Draw’ first, and Copy/Paste the result then to a different document if needed.)
I see… that is very useful, now it’s clear to me the idea of how to do it. But I’m lost in details. I need a little more help please. How I enable that snap option? It’s important to me to draw those lines object so they match and don’t deform the measure.
AFAIK you have only the option Snap To Grid' for graphics in Writer. In Draw you can choose more detailed snapoptions via >Tools>Options>LibreOffice Draw>Grid`.
Thank you.