Hello, I haven’t been able to figure out how to resolve my problem so I’ve come here to maybe get an answer.
Here’s what OS and version of LibreOffice I’m using.
Version: 7.3.3.2 (x64) / LibreOffice Community
Build ID: d1d0ea68f081ee2800a922cac8f79445e4603348
CPU threads: 16; OS: Windows 10.0 Build 19043; UI render: Skia/Raster; VCL: win
Locale: en-US (en_US); UI: en-US
Calc: CL
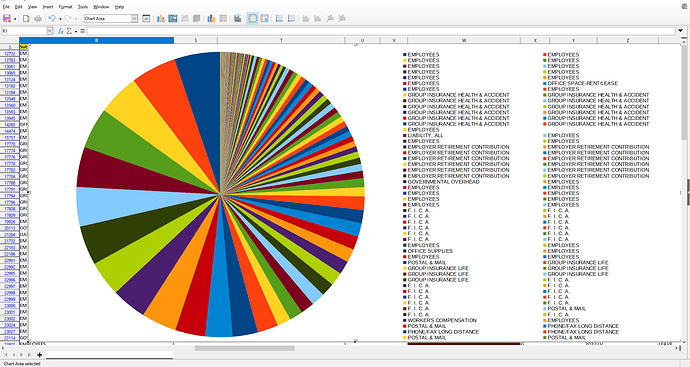
So within LibreOffice Calc, I’ve created a pie chart, but it lacks consolidation. There are 13 categories/labels I have and I would like the pie chart to display the sum of each of those 13 categories rather than displaying each expenditure from those categories in the legend and the pie chart.
This is what it currently looks like and you can see what I mean by a lack of consolidation.

