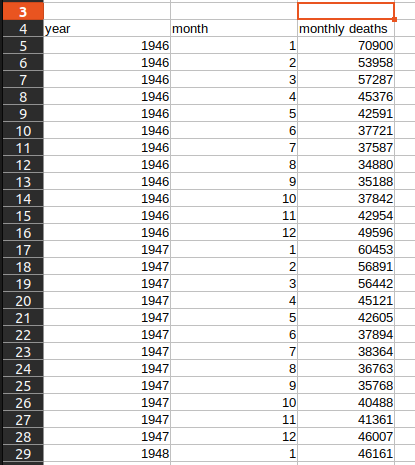
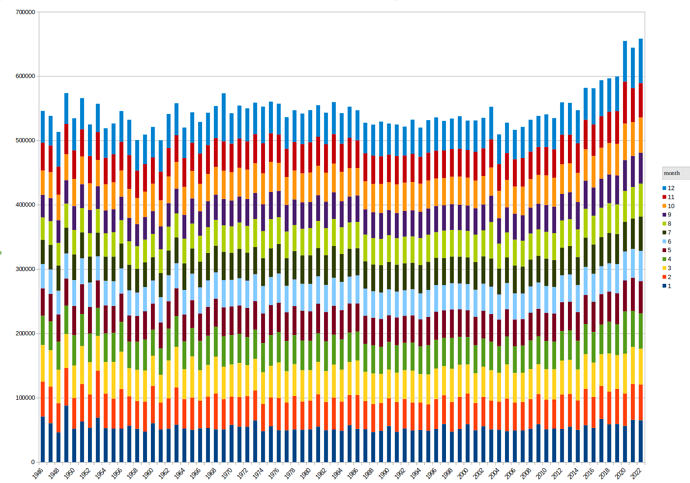
Hi. I have monthly data that I would like to convert into yearly data, so I can plot a smoother graph with less points.
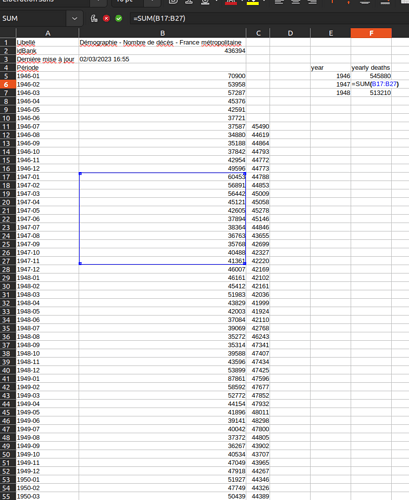
So the formula is pretty simple, but I tried filling it for 3 years and then dragging the formula, but it doesn"t work correctly.
The formula I typed in F7 is =sum(B29:B40), and I want the formula in the next cell F8 to be =sum(B41, B52), but when dragging the formula it puts =SUM(B8:B19) (so it takes the first fomula in F5 =SUM(B5:B16) and adds one for each column, instead of adding 12)
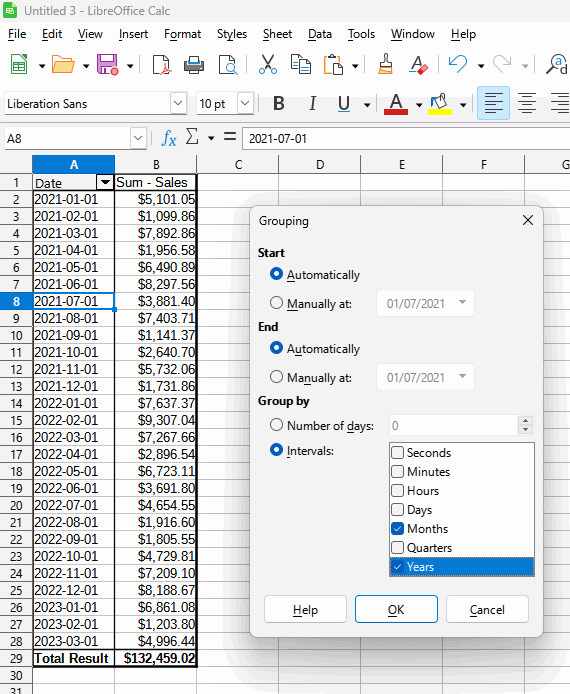
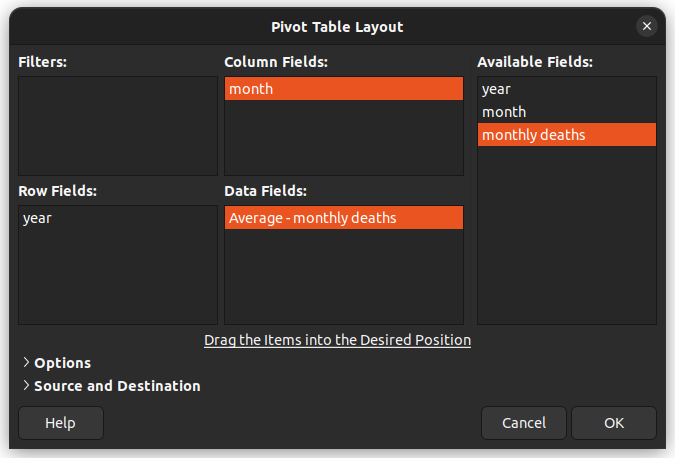
Is there an automated way to achieve what I want?
Alternatively, is there a way to plot ever 12th data point?

