Count prices if conditions are fulfilled

Using Libre Calc 6.0.1.1(x64) on Windows 10.

Say I have these data:

A               B
Buy paper      100
Buy pencil      50
Electricity     300
Water           100

Now let’s say I want to create a pie chart where it would display that utilities (water + electricity) are 72% and the rest is office expense.

Imagine there are thousands of rows like this. Is there a way to create a pie chart / summarize the expense categories ?

Basically :

Sum of buying stuff : if value in column A contains “Buy” add the value in column B

Sum of utilities expense : if value in column A contains “Water|Electricity|Gas” add the value in column B

so I can see quickly see the overview, whats the largest expense this month. If necessary I can program, no experience with excel vba or calc though.

@vulanala When editing a question by changing the meaning, please note the edited portion. This can change the entire meaning of the question making the person answering look like they didn’t read the question. Your modification from:

Is there a way to do that with function or macro?

To:

Imagine there are thousands of rows like this. Is there a way to create a pie chart / summarize the expense categories ?

Hello,

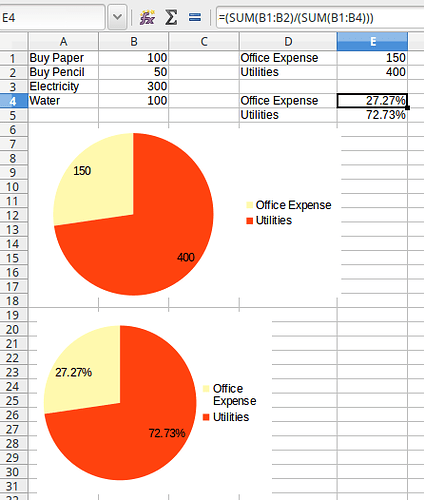
There is no need for function or macro. Just create totals of what you want and base the chart upon the totals:

Edit (corrected separator formatting):

With clarification, here are formulas now used in E4:

=(SUMIF(A1:A4;"Buy*";B1:B4)/(SUM(B1:B4)))

and E5:

=(SUM(SUMIF(A1:A4;"Water";B1:B4) ;SUMIF(A1:A4;"Electricity";B1:B4);SUMIF(A1:A4;"Gas";B1:B4))/(SUM(B1:B4)))

With proper setup, a change in ‘Electricity’ amount will automatically display correct percent in chart.

I realized I wasnt being clear :slight_smile:

Yes, it surely can be done manually. The thing is, I came into a company with an existing excel sheet for expenses that’s not very well organized. Thousands of rows per month just arranged chronologically. Now I could go through each entry manually but certainly I’d rather automate.

EDIT:
Awesome.
Thank you very much. This works perfectly. I didnt know about SUMIF.

This also works for E5:

=SUMIF(A1:A4;"Water";B1:B4)+SUMIF(A1:A4;"Electricity";B1:B4)+SUMIF(A1:A4;"Gas";B1:B4)/(SUM(B1:B4))

If this answers your question please tick the :heavy_check_mark: (upper left area of answer). It helps others to know there was an accepted answer.