Hello everyone, I would like to create a chart that shows all the cities listed in column A and all the connections with the cities listed in column B, in order to have a kind of map.
Do you have an example file?
Like the summary of a sports competition? Horizontally the cities A, vertical the cities B, at the crossing of a row and column you can indicate with 0 or 1 whether cities are connected. One way connections have a 1 in the A-B crossing and a 0 in the B-A crossing: the upper and lower diagonal are different in that case.
Also a C-C table can be considered, where C is the largest number of cities in either B or A.
Depending on the number of cities a database can be a more appropriate approach to obtain a list of connections between cities
If your goal is to produce a map, i.e. a graphical representation of the connections between cities, LO is not the ideal tool for this. You didn’t describe the form of your input data. It could be a spreadsheet containing a connection matrix as suggested by @parsely or a database.
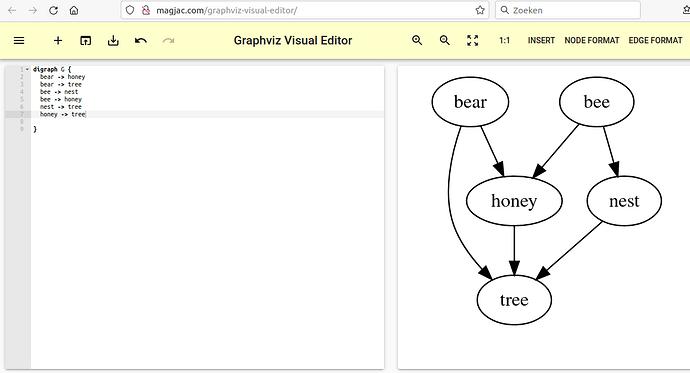
A common automatic graphing tool is Graphviz. Your main problem is to export your data into the syntax expected by Graphviz. This can probably be done without macros by presenting your spreadsheet data in a new sheet, using formulas, and exporting this sheet only to a text file. From a database, you need to design a specific query and write extracted data in the correct form to a text file.
If it’s actually about a map there is need of GeoData: Where to get? What geographical range? How much coarsened or schematized? What data format? How to add graphical content?
If it’s about a graph as @parsley supposed, there already were a few computer users interested in solutions. See https://elise-deux.medium.com/list-of-free-graph-visualization-applications-9c4ff5c1b3cd e.g.
LibreOffice (Draw) mainly supports graphs of a kind of flow-chart design. To transform a contingency matrix (as described) to a graph of the (supposedly) wanted representation with the help of connectors would require a lot of custom programming, imo.
Image
This is the result I want to accomplish.
Basically I want to create a matrix as @parsely said then a graph as the map I posted.
After that, a user input 2 places and the connection between them highlight or change color.
So basically I also need a way to manage all the links in the macros.
IMHO, not possible with LO. Perhaps with heavy macro programming, but then you’d better find a dedicated software. This looks like managing railway routes or energy lines.
… more easily develop a dedicated software from scratch.
What would you recommend?
You didn’t describe your context nor your goal. You asked about an implementation within LO after some design decisions you already made. So let’s start back from the beginning.
Apparently, you want to represent a network. You want to be able to click on some link (or query a possible route or path in the associated DB) and retrieve properties (and also highlight it on screen). Do you also want to simulate the network behaviour?
Your image looks like the railway network around Milano.
A quick internet query suggested RailRoute. I don’t know what it’s worth. But you can have a try. There is also OpenRails.
If your request is for professional business-quality software, look at OpenTrack.

