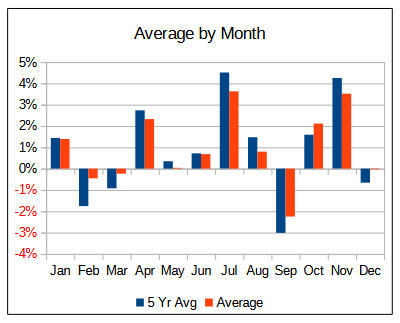
Have several charts I would like to have a macro for creating.
The use case is a macro that downloads a set of data into an empty spreadsheet. Populates some cells with formulas and applies formatting.
At this point would like the macro to create these several charts.
Have seen some macros to create a simple chart but nothing that gets into the formatting that a person would typically apply to a chart. Such as axis label format, category and data series, legend placement, etc.
Is there a way to export a chart’s parameters for use in a macro? Or even better export a chart as a macro sub?
If not, can you point me to a real good chart macro example that goes beyond just creating a default chart?
Here’s a formatted chart example of what I’m looking to create from macro.

