Sorry, I am not used to doing this and need some basic help.
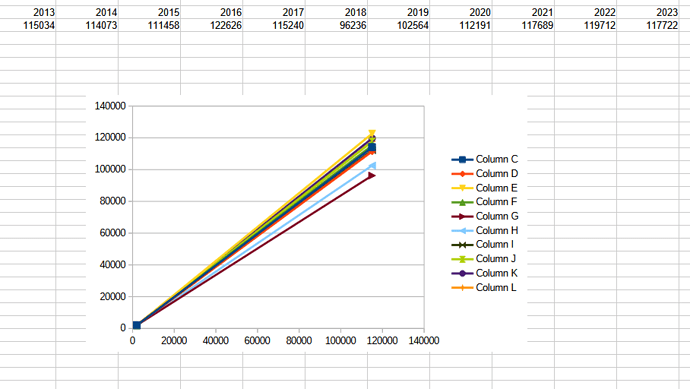
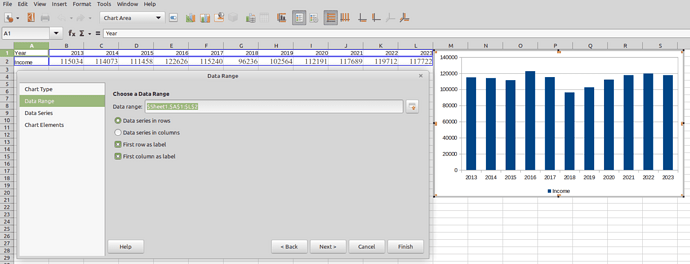
I have a simple spreadsheet showing years 2013 to 2023 in a row (a column for each year) and the row below shows “income” for each year in the range 100,000 to 120,000.
How do I generate a line graph showing each year 2013 to 2023 along the X axis, with income level on the Y axis ranging from 100k up to 120k on the Y axis, (Not 0 to 120K )
Thanks
Keith


