Can a line equation be altered?
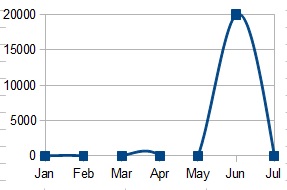
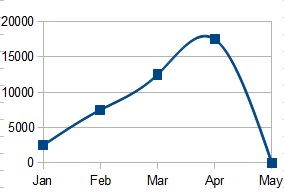
I have a smooth line, XY scatter chart using a cubic spline equation, the problem is that the cubic spline equation produces negative values when plunging to zero. When graphed, this causes people to wonder “how do you get a negative number of widgets”, or the graphline vanishes and reappears as it goes microscopically above and below zero.
Is there a way to either “override” the cubic spline equation with my own (identical, except with a if y<0 then y=0 line), or to create my own equation along the lines of:
M_Bison_Cubic_Spline(passedinfo)
    y=LO_Cubic_Spline(passedinfo)
    if y<0 then y=0
    M_Bison_Cubic_Spline=y
End function
Then how would I tell my ochart=blah.Charts(0) to use my custom equation? Am I completely off-base here? I know I’m mixing and mangling terminology, let me know if I can help clarify this.
Lastly, everyone keeps saying “you get what you pay for” and stuff like that… It’s B.S. Your software and support has been invaluable (this is my first question that I couldn’t find the answer to), so thank you.


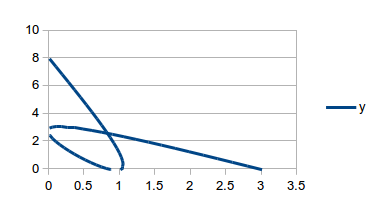
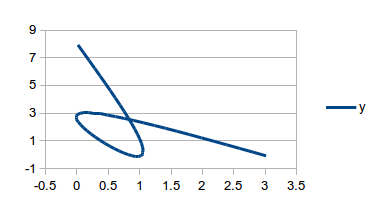
 Bug fdo#37889 implemented this detail (code commit included). Bug fdo#47787 is seeking to correct B-spline interpolation (so evidently it was not perfect first time). Bug fdo#53875 was an attempt to get the B-spline formula changed but was closed as WONTFIX due to the requirement for spec conformance. I think, if you made your case clearly, that an “enhancement” could be proposed to have the cubic spline interpolation formula altered / improved. Can you have a read of the spec and comment here again with your thoughts? Feel free to provide a further answer instead if you like (with greater detail), as it is good to have the information publicly available for all. Thanks.
