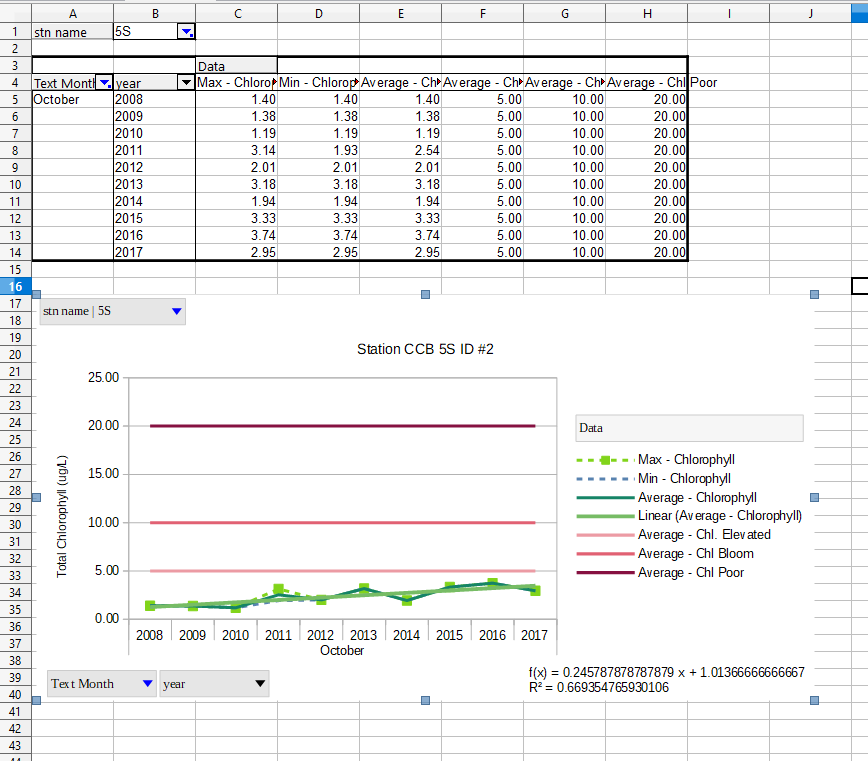
So does anyone know a way to do this? I am trying to prepare a series of charts and pivot tables are the best options because of the amount of data. My problem is simple the legend in the chart inherits the titles from the data columns, data columns inherit their names from the main datasheet plus the function used with the data.
As an example, I am charting water quality and I wanted to show three threshold values in the chart along with the actual data from the water quality sampling. In this example, I would prefer not to show the function used to draw a straight line, just what that line represents.
Any help would be appreciated!

