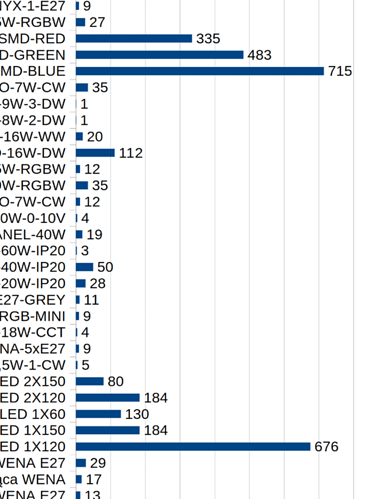
I need to display a number correlating to the graph bar’s. It can be at the end (on top) of the bar or inside it, preferably on top, because some bars are too small to contain visible numbers.
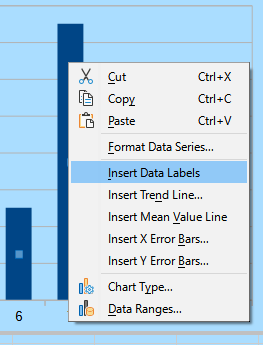
All I found was this:
However, my chart contains a few dozens (maybe over a hundred) of bars, so going one each at a time is not possible. Additionally, as I said, the difference between the lowest bars (1 to 10) and highest ones (thousands) is too big, so the low ones are almost not visible at a scale, so it’s not possible to add any label inside it.
Since the last topic was almost 6 years ago, I wanted to ask if this was added at some point, or is it still not possible to add such data to the chart?


