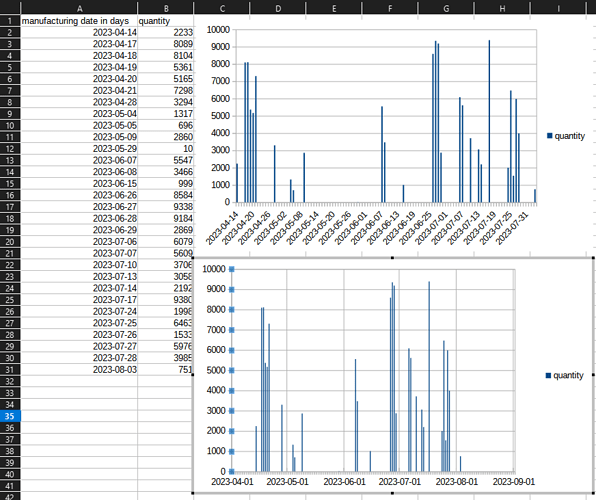
Hi PTF, I have the exact same issue now and I think I found the solution. I am not sure if you are still using LibreOffice but hopefully, this solution help other people who have the same issue.
So at the beginning, the column plot, and the XY Scatter plot both displayed my X-axis as integer units starting with 0. Same as your case. Then I double-checked my date column format and it is indeed date (yyyy-mm-dd). I even tried to convert the date format to (mm/dd/yyyy) but no help. I also tried copying the columns to a different sheet (but still under the same ODS file) however, the plot remained the same.
Next, I copied the columns to a separate ODS file and pasted only values. The plot works this time! The Calc recognized the format and displayed it in the right way with its default parameters. I started thinking about how can I do the same thing in my original ODS file.
Here is the actual solution:
Select the date cells (for me, A2:A31), copy
Right click on an empty cell, then paste special → Unformatted Text
In the opened Text Import window, locate the Fields section at the bottom of the window. Click on the date column and the Column type drop-down menu will be active. Select the corresponding format for your case (mine is Date(YMD)) from the menu. Then click OK.
Now you can use this newly pasted column as your date column and the chart should work for you now. You can also cut and paste this newly generated column back to the original date column (overwrite it) so you still have your sheet well-organized.
By playing with the X-axis of the plot, you can even turn it into a better view with a major grid that divides the plot based on months. Like the plot on the bottom.
I guess the reason is that the right-click menu → Format Cells does not correctly convert the date. Although when you check the converted cells it says Date as its format, the cells can not recognized by the chart. Copying and Pasting unformatted text guarantees the format is indeed Date.

