How to have two different chart types (one line only the other points only) on the same chart?
Hello,
if you really mean different chart types then the answer is: You can’t - since the chart type (in Calc’s terminology of chart type) is fixed for a certain chart - it is either a XY(Scatter) or a Line or a Pie (to name few) chart.
However, I interpret your question that you want to format your different data series differently and this can be done. Perform the following:
Right click on the chart -> Edit- Click on an arbitrary data point of a data series, whose appearance you want to change (all data points get selected by this action)
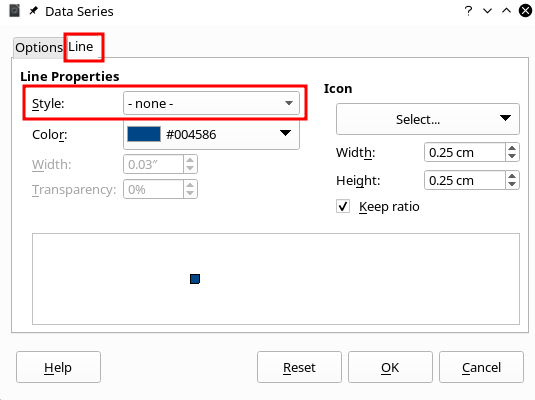
Right click -> Format Data Series... -> Tab: Line- Change in drop down Style: from
Continuousto-none-(or vice versa) - Click
OK

See also the following sample file: FormatDataSeriesDifferently.ods
Hope that helps.
As much as I’d like this answer, but it doesn’t seem to be correct anymore.
At least on Libreoffice 7.4.1 (on Mac here) there is no Option to change the type in the Format Data Series ... dialog
The whole Tab is missing here.
Looks like major changes in the last 2years 
Is there any other way to change the type?
FWIW: I just checked an old file, where I changed types and saved it before. It looks like it loads correctly, so the code for rendering still seems to work fine, but the user interface doesn’t allow to select the functionality.
Thanks I’ve gone back to Excel, pity because i don’t like MS but it works.
Is line there in Safe Mode, Help > Restart in Safe Mode > Continue in Safe Mode?
If it does then look at LibreOffice user profile - The Document Foundation Wiki
BTW I assume you right-clicked on a Data Point, not the background (Format Wall, Format Area)
So, lets try to put that politely: I just invested another half an hour of MY time verifying, that everything here on my side is exactly as I pointed out before already. I wrote about the exact version of the software I’m using. I was using a fresh install already. Nevertheless, I restartet even in Safe mode, just to provide verification, that I’m not a newbie, and that I know where to klick … while on the other hand, Mr “EarnestAI” doesn’t even seem to bother, to invest his own time and look for himself. Why? I don’t get this.
I believe firmly, that this is a feature, that was there once before, alas, I’ve even used it already. Still it is no longer here, and thats what I documented in this thread, to help others, who might look for the feature.
I don’t get it …
So to repeat again: This solution doesn’t work with LibreOffice v7.4.1 on Mac (I cannot and will not say for other platforms) - So either this is a bug in LO or this solution should be marked as deprecated.
A new install does not affect the User Profile, if there is corruption in the profile it is not fixed by a new install.
Safe Mode does not load extensions nor Skia so it removes some possible causes of problems.
The Line tab has not been removed. If it is a bug then it should be reported, How to Report Bugs in LibreOffice - The Document Foundation Wiki
The answer seems to be
if you really mean different chart types then the answer is: You can’t - since the chart type (in Calc’s terminology of chart type is fixed for a certain chart - it is either a XY(Scatter), Line Pie, Column … chart.
However I interpret your question that you want to format your different data series differently and this can be done. the following:
Right click on the chart → Edit Click on an arbitary data point of a data series, whose appearance you want to change (all data point get selected by this action) Right click -> Format Data Series.. -> Tab: Line
Change in drop down Style: from Continous to -none- (or vice versa)
Click OK
Thanks
Mike G
Why do you repeat my answer instead of accepting the answer by clicking the check mark ( ) next to the answer?
Was browsing for solution to different problem when I ran into this issue. The solution presented by anon73440385 used to work. I did it before. So I was a bit surprised by jwalzer’s reply. I checked on LibreOffice on my macbook (can’t get “about libreoffice” to work… so can’t tell what version. I also checked on libreoffice on my xubuntu22, running 7.3.7.2 libreoffice, and it does not work. Existing chart with mix of column chart series and line chart series continues to display as expected. But you can no longer create new chart with mixed chart types. And you cannot change chart type of single data series. If I select one data series and try to change chart type (e.g. from column type to line type), it will change ALL data series. If you select a data series and do format data series, it will show only the tabs relavent to the chart type it already is - no option to change to new chart type. I.e., if the series you selected is a line chart, it only shows options tab and line tag, while for a series that is already a column type, it shows options, area, transparency, and borders tabs. There is no way to switch a single data series to different chart type. I believe this should be reported as a bug… In fact, I’ll go ahead and file this bug right after I’m done with this reply.
tdf#161969
