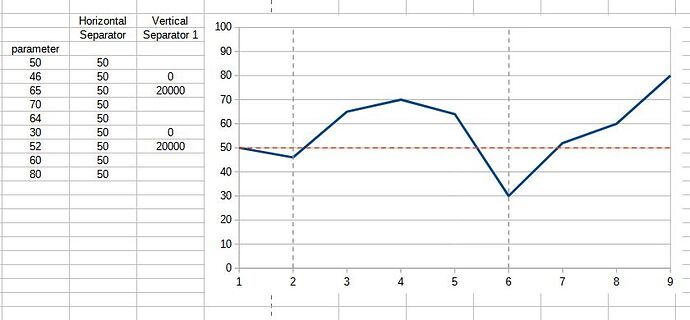
I found an easy way to do this, so I thought I’d share my solution here:
- To insert vertical lines:
- add an extra data column
- where you want to draw a vertical line enter 0 as value. In the next line, add 200000 as a value in the same column (you can do this as often as you want for every vertical line you want to add). Make this value large enough so that the result is a vertical line (if you make the value is too low, it will result in a tilted line)
- create the graph (chances are that at first sight all you will see is a vertical line because the Y-axis will go to 200000 or whatever large value you entered, hence: )
- click the Y-axis (vertical) and in “scale” tag, unflag “automatic” for the minimum and maximum values and enter the real min and max values (in my example 0 and 100)
- To insert a horizontal line
- add an extra data column
- enter the same value in every row of this column
- create the graph
Done.


