Empty chart with Series fully defined?


calc_empty-chart_1

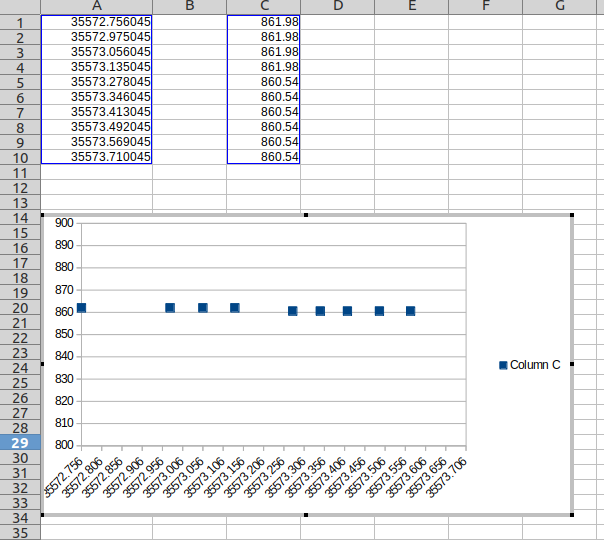
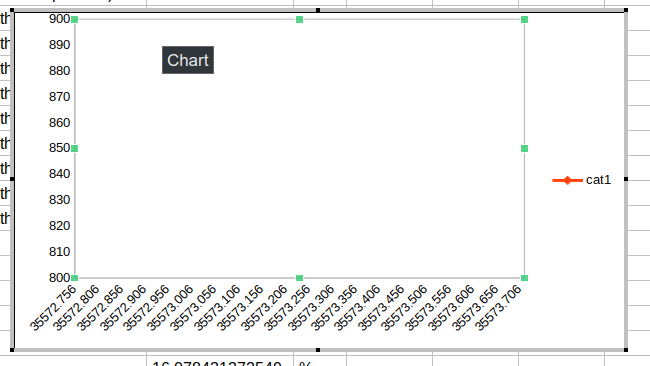
In a small sheet (about 40 rows by 4 cols) I have created an apparently empty chart with one Series defining a subset of the sheet (taken from the top 10 rows). I have defined both X and Y axis for the Series using, in each case, data from an appropriate column; the other columns in this small sheet are not referenced at all. The axis ranges appear correct with labels showing expected values on the axis and the source spreadsheet shows both X and Y ranges highlighted (ie. outlined). But there are no points displayed in the chart.

What gives?

Hello,

Not into XY or scatter charts but using Ubuntu 20.04 and:
Version: 7.2.5.2 / LibreOffice Community
Build ID: 499f9727c189e6ef3471021d6132d4c694f357e5
CPU threads: 8; OS: Linux 5.4; UI render: default; VCL: gtk3
Locale: en-US (en_US.UTF-8); UI: en-US
Calc: threaded

Had no issue:


.
Screenshot at 2022-02-02 18-33-23
.
Screenshot at 2022-02-02 18-33-45

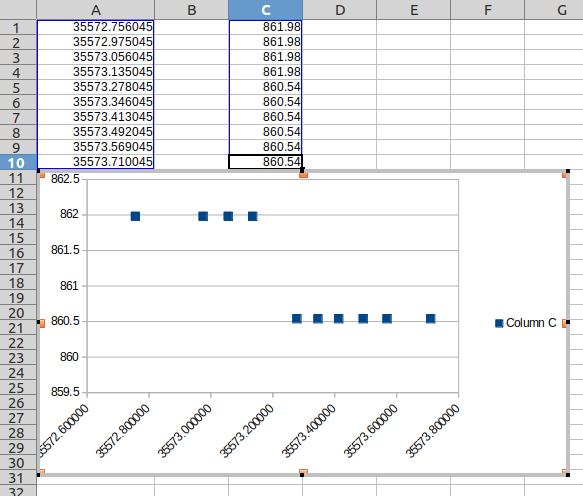
And maybe this (no editing by me) is the way the XY should be:
Screenshot at 2022-02-02 18-50-14
.
In any case, data shown.

Thx for that working example. You must have a good way to pull data out of pics…

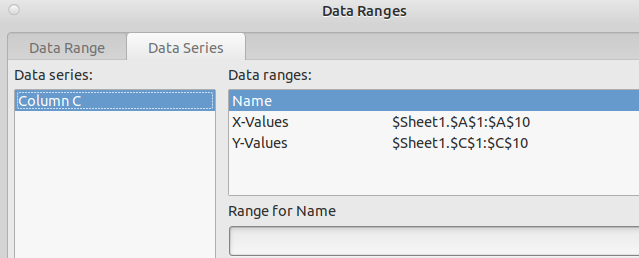
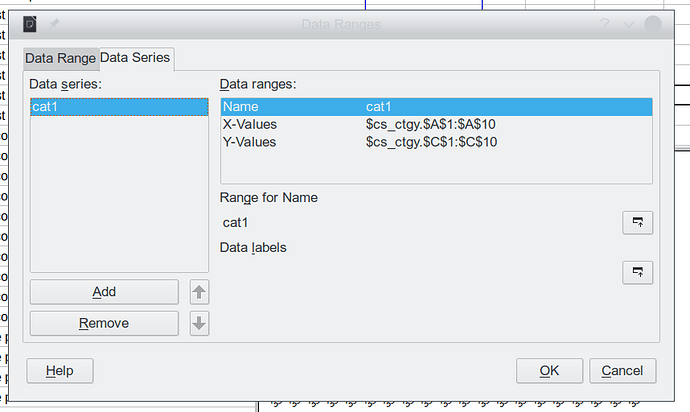
Now, I’m feeling my way here. But, it looks like maybe DataRange must ALWAYS be defined (one way or another). Is that right? I’m afraid I see no functional reason for that, which makes it hard to parse. Below is my Series dialog which shows why I’m asking this question.

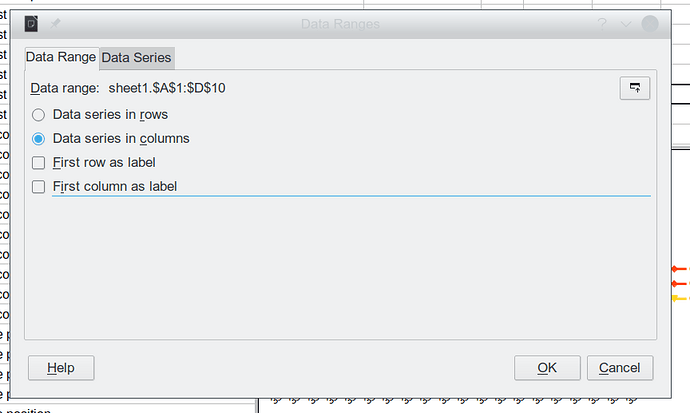
Originally I thought DataRange for my data was supposed to be one single block which contained everything; that’s what I (mis) understood from reading the docs several times. That resulted in Series which didn’t make any sense to me. So I went straight to defining the Series for X and Y and that looked like it should work, but no.

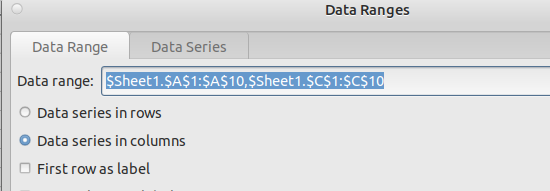
Here is what I tried and came up empty as in my 1st post:

Here is how I thought DataRange was meant to be defined:

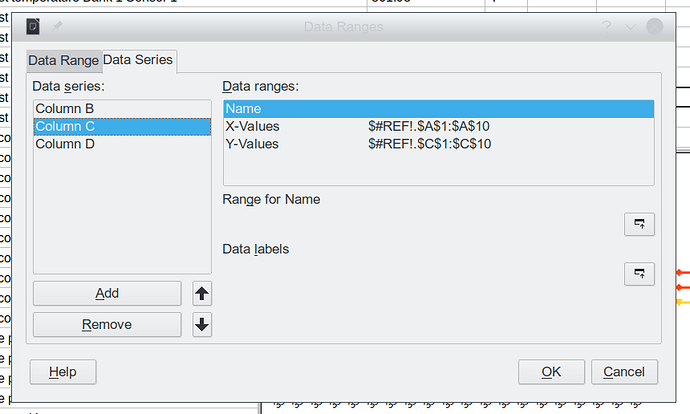
Here’s what then displayed in Series after defining all source data in one DataRange as I thought was asked for:

Which is what led me to try to define Series directly. I find this very confusing as the data and setup info required for an X/Y chart seem to be wholly defined by my Series ranges - and yet it doesn’t work.

Which leads me to ask: What is the point of the DataRange entry if it essentially gets duped and reworked in the Series entry? I’m trying to find a functional trail using the tools (dialogs) offered by Chart, an understanding of how the pieces fit together, which will aid in applying this effort down the road in more realistic situations.

Thx,
Rufus
@rlaggren

Sorry, but at this point I don’t even know what type of chart you are trying to create.

You did it in your example. I just don’t know why that worked. Trying understand the procedure.

As stated in my opening comment, not into XY/scatter charts. I simply selected all of col A and all of col C and then insert chart and selected XY chart. Resulted in second chart. First chart was same but played with axis to reflect yours.

Thanks for your help. It really does help to see somebody take a slightly different approach.

But I need to figure out how you “got there” with your method. Otherwise I won’t be able to repeat. And that means figuring out how I need to think about these dialogs and the methods and terms they embody. I don’t seem to be on the same page as the gui designer. But that’s fixable.

I’ve got some homework to do.

Again thanks for you example and your reference. I hadn’t found that guide yet.

Regards,
Rufus

This is the only other (that I currently recall) time with Scatter charts for me → Creating a scatter plot in calc using python
.
That post does note tdf#98543 which is an XY bug regarding a column with Categories.

You imported wrong data. The numbers in your screenshots are no numbers. They are text.

5 Likes

To convert to numbers, see Frequently asked questions - Calc - The Document Foundation Wiki

3 Likes

Now that is a head smack! First thing I’ll change this morning.

Thanks.

Uploading a document is always preferable over screenshots (unless you have a display issue).