Im trying to make a spreadsheet for rebalancing a portfolio. See pic:
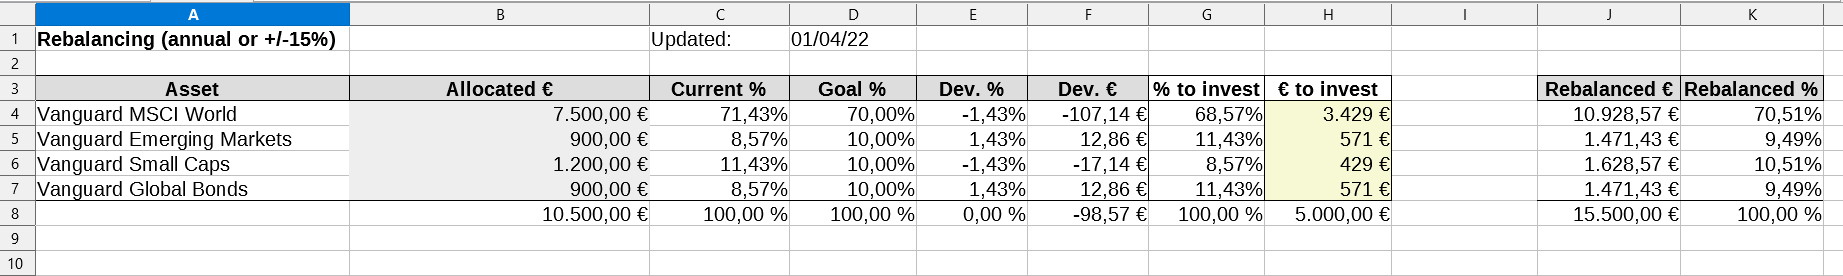
The idea is that you enter values in € for each asset you are holding, (the B4 to B7 cells) and you get the total below as well as how much % each asset represents (C4 to C7)
You also enter the % that each asset should represent in a portfolio (D4 to D7).
With this then you get the devitation in % and € (E and F columns) and how should you distribute your next investment in order to compensate for said deviations (in this example, im investing 5000€ next, in the %'s seen in column G, and expressed in € next in column H)
The result is in J and K, but notice how in K (Rebalanced %) it doesn’t go back to 70%, 10%, 10%, 10%, but 70,51%, 9,49%, 10,51% and 9,49%
I don’t know why, it has to be something obvious but i’ve stared at this for too long now to realize.