Even scale on x axis for irregularly spaced items

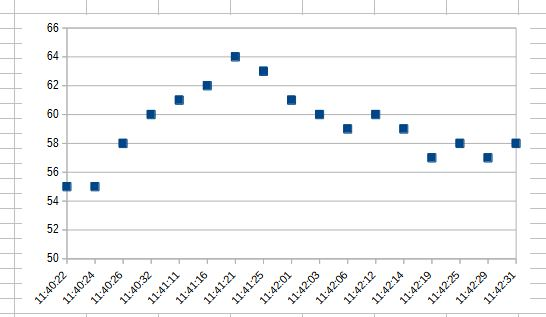
I have data as follows, a reading (between 50 and 70) at a certain time
image

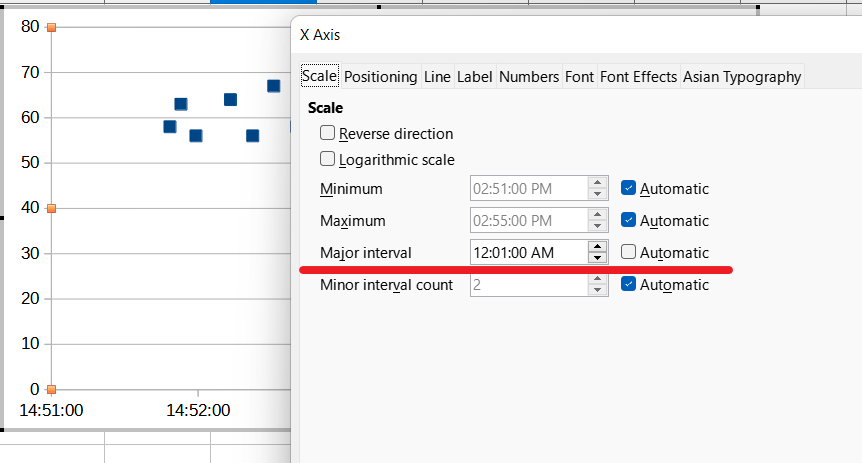
On this graph, although the results are randomly spaced, those results are evenly spaced on the x axis
I want to see evenly spaced times on the x axis, in this instance 11:40, 11:41, 11:42 11:43

I have searched everywhere for an answer with no luck
Any answers please?

Thanks for this reply but I can’t get to these choices

The times are definitely formated as time
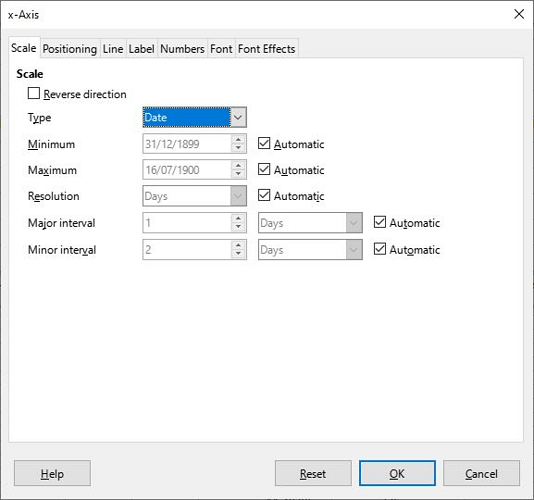
The menu for x axis only has choices of Automatic, Text or Date
The Date choice gives me the following

I can’t get to the screen you show with times instead of dates

Are you using XY graph?

I was trying ‘points only - line’. I have switched to ‘x-y scatter’ but the x axis is now simply the cell row number.

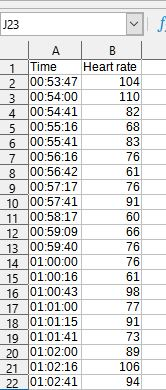
This is the simple data I am struggling with. I am sure I will kick myself when I crack it !

image

@mikep2022 ,

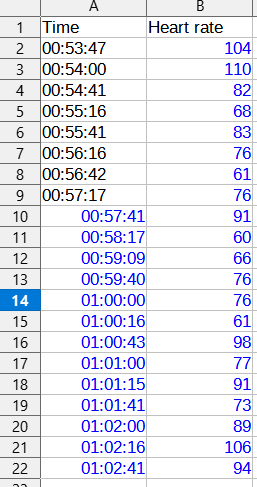
Your date looks like it’s not a date but text!
Check that out?

Press Ctrl+F8

If it stays black, it’s text.

2022-07-30 17 19 45

3 Likes

Additionally - have you defined the X range after changing to the XY? (that would happen naturally when you create the XY from scratch, but may be needed manually in case of change from another type)

Ahaa !
OK, thanks
I have taken the first few and removed the single quote mark (text signifier) from them and formatted as HH:MM:SS and it works a treat. BUT I have around 27,000 of them to do. Is there a way of converting but not manually

These are text translations of Unix timestamps. I cant for the life of me work out how to convert those timestamps to HH:MM:SS. Any formulae I have found by searching do not work

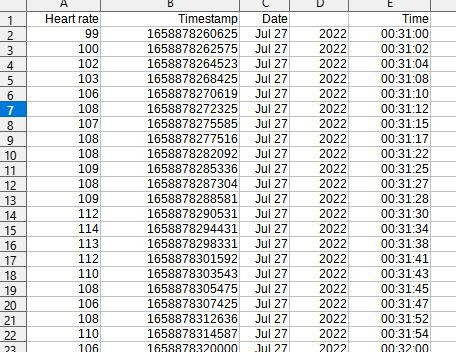
example of original data follows

image

Any pointers please?
Thanks for everything so far

UPDATE Just found =xxxxxxxxxxx/1000/86400+25569 and convert to Date + Time, then extract time
works well

1 Like

Your data looks not like usual Unix timestamp (seconds since Unix epoch), but as milliseconds since then. So the formula needs to take that into account.

=B2/1000/60/60/24 + DATE(1970;1;1)

https://wiki.documentfoundation.org/Faq/Calc/How_to_convert_number_text_to_numeric_data

1 Like

Well thankyou everybody

The result is exactly what I need

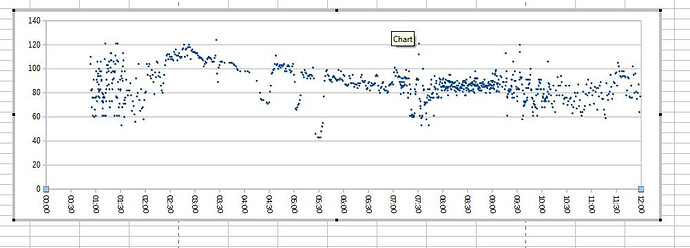
midnight to midday in half hour intervals as an example

It was a matter of find .+ and replace with $0 for all the text times (would not have guessed that in a millon years ! )
Thanks again

EDIT… I should add that the whole sequence for conversion is first of all to clear direct formatting from the date ‘figures’ and then find .+ and replace with $0

1 Like